Based upon the given financial statement, would you provide a credit line to this company? Support your decision by reference to your work in parts (1) through (4)
Based upon the given financial statement, would you provide a credit line to this company? Support your decision by reference to your work in parts (1) through (4)

Chapter11: The Corporate Income Tax
Section: Chapter Questions
Problem 5P: Fisafolia Corporation has gross income from operations of $210,000 and operating expenses of...

Related questions

Topic Video
Question
Based upon the given financial statement, would you provide a credit line to this company? Support your decision by reference to your work in parts (1) through (4).
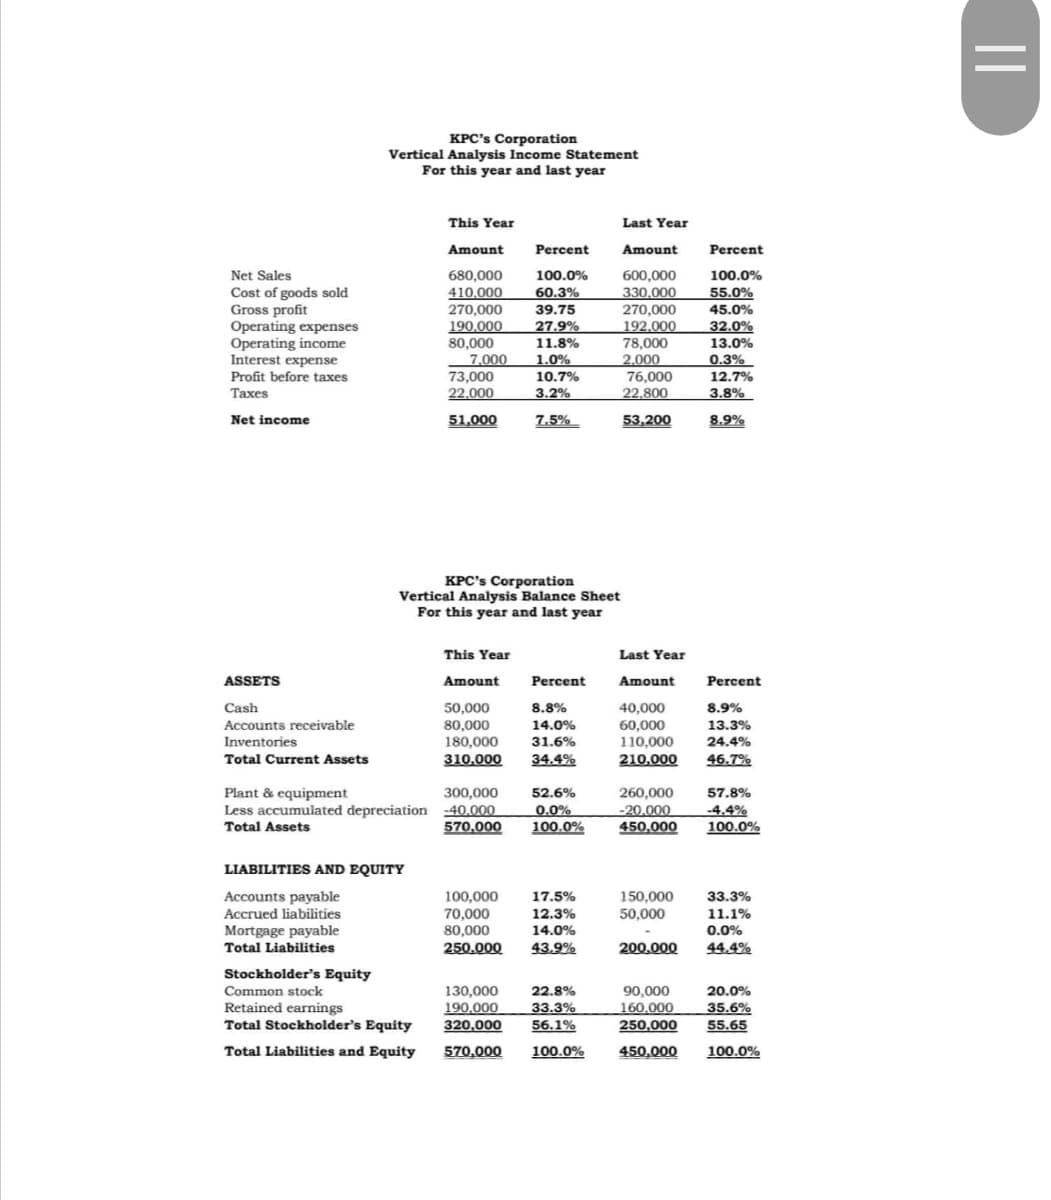
Transcribed Image Text:KPC's Corporation
Vertical Analysis Income Statement
For this year and last year
This Year
Amount
Percent
680,000
100.0%
410,000
60.3%
270,000
39.75
190,000
27.9%
80,000
11.8%
1.0%
73,000
10.7%
22,000
3.2%
51,000
7.5%
KPC's Corporation
Vertical Analysis Balance Sheet
For this year and last year
This Year
Amount
Percent
50,000
8.8%
80,000
14.0%
180,000
31.6%
310,000 34.4%
300,000
52.6%
0.0%
-40.000
570,000 100.0%
100,000
17.5%
70,000
12.3%
80,000
14.0%
250.000
43.9%
130,000
22.8%
190.000
33.3%
320,000
56.1%
570,000 100.0%
Net Sales
Cost of goods sold
Gross profit
Operating expenses
Operating income
Interest expense
Profit before taxes
Taxes
Net income
ASSETS
Cash
Accounts receivable
Inventories
Total Current Assets
Plant & equipment
Less accumulated depreciation
Total Assets
LIABILITIES AND EQUITY
Accounts payable
Accrued liabilities
Mortgage payable
Total Liabilities
Stockholder's Equity
Common stock
Retained earnings
Total Stockholder's Equity
Total Liabilities and Equity
7,000
Last Year
Amount
600,000
330,000
270,000
192,000
78,000
2,000
76,000
22,800
53,200
Last Year
Amount
40,000
60,000
110,000
210.000
260,000
-20.000
450,000
150,000
50,000
200,000
90,000
160.000
250,000
450,000
Percent
100.0%
55.0%
45.0%
32.0%
13.0%
0.3%
12.7%
3.8%
8.9%
Percent
8.9%
13.3%
24.4%
46.7%
57.8%
-4.4%
100.0%
33.3%
11.1%
0.0%
44.4%
20.0%
35.6%
55.65
100.0%
=
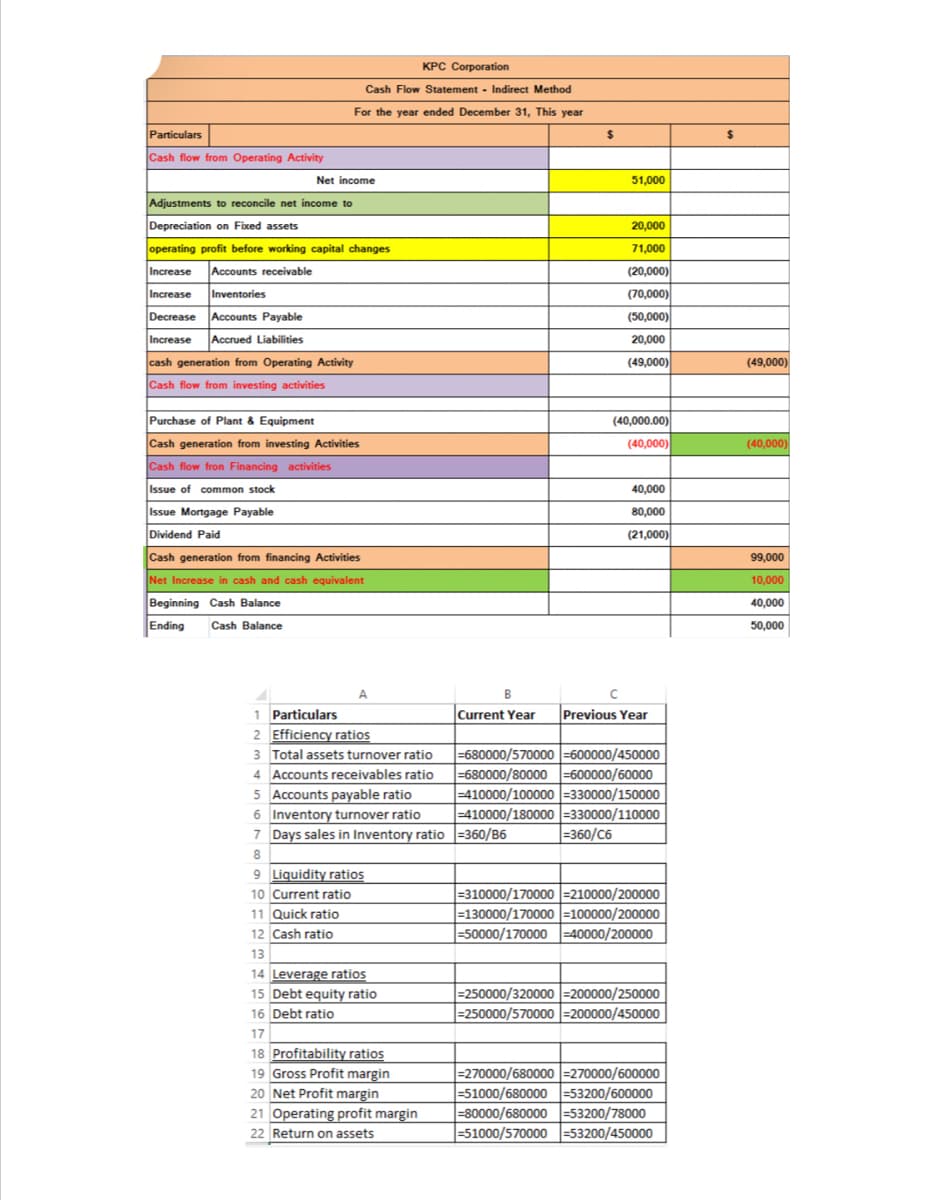
Transcribed Image Text:KPC Corporation
Cash Flow Statement Indirect Method
For the year ended December 31, This year
Particulars
Cash flow from Operating Activity
Adjustments to reconcile net income to
Depreciation on Fixed assets
operating profit before working capital changes
Increase Accounts receivable
Increase Inventories
Decrease Accounts Payable
Increase Accrued Liabilities
cash generation from Operating Activity
Cash flow from investing activities
Purchase of Plant & Equipment
Cash generation from investing Activities
Cash flow fron Financing activities
Issue of common stock
Issue Mortgage Payable
Dividend Paid
Cash generation from financing Activities
Net Increase in cash and cash equivalent
Beginning Cash Balance
Ending Cash Balance
A
1 Particulars
2 Efficiency ratios
3 Total assets turnover ratio
4 Accounts receivables ratio
5 Accounts payable ratio
6 Inventory turnover ratio
7
Days sales in Inventory ratio=360/B6
8
9 Liquidity ratios
10 Current ratio
11 Quick ratio
12 Cash ratio
13
14 Leverage ratios
15 Debt equity ratio
16 Debt ratio
17
18 Profitability ratios
19 Gross Profit margin
20 Net Profit margin
21 Operating profit margin
22 Return on assets
Net income
$
51,000
20,000
71,000
(20,000)
(70,000)
(50,000)
20,000
(49,000)
(40,000.00)
(40,000)
40,000
80,000
(21,000)
B
с
Current Year Previous Year
-680000/570000-600000/450000
-680000/80000=600000/60000
-410000/100000-330000/150000
-410000/180000 -330000/110000
=360/C6
=310000/170000=210000/200000
=130000/170000-100000/200000
-50000/170000-40000/200000
=250000/320000-200000/250000
=250000/570000-200000/450000
=270000/680000 -270000/600000
-51000/680000 -53200/600000
-80000/680000 -53200/78000
-51000/570000-53200/450000
$
(49,000)
(40,000)
99,000
10,000
40,000
50,000
Expert Solution
This question has been solved!
Explore an expertly crafted, step-by-step solution for a thorough understanding of key concepts.

Step by step
Solved in 2 steps

Knowledge Booster


Learn more about
Need a deep-dive on the concept behind this application? Look no further. Learn more about this topic, accounting and related others by exploring similar questions and additional content below.Recommended textbooks for you