2. 0. 9- 4. 000 r0.5.2500 000- 0009 (3.5,7200) 000- pe used LO approxIImate the udld UISLITbution. 40 MULTIPLE CHOICE Question 15 Since spring started, Kareem has been surveying the growth of leaves on his neighborhood trees. He goes out every day and computes the average number of leaves on a sample of trees. He created a scatter plot where the y- axis represents the average number of leaves on the trees, and the x-axis represents the number of weeks since spring started. Use the 2 given points to write a linear equation that can be used to approximate the data distribution.
2. 0. 9- 4. 000 r0.5.2500 000- 0009 (3.5,7200) 000- pe used LO approxIImate the udld UISLITbution. 40 MULTIPLE CHOICE Question 15 Since spring started, Kareem has been surveying the growth of leaves on his neighborhood trees. He goes out every day and computes the average number of leaves on a sample of trees. He created a scatter plot where the y- axis represents the average number of leaves on the trees, and the x-axis represents the number of weeks since spring started. Use the 2 given points to write a linear equation that can be used to approximate the data distribution.

Chapter1: Equations, Inequalities, And Mathematical Modeling
Section1.2: Linear Equations In One Variable
Problem 6ECP: The number y (in thousands) of male participants in high school lacrosse in the United States from...

Related questions
Question
A) Y=1566.67x + 1716.67
B) Y= 3x + 2000
C) Y= 4700x + 1500
D) Y= x + 1700
Transcribed Image Text:2.
0.
9-
4.
000
r0.5.2500
000-
0009
(3.5,7200)
000-
pe used LO approxIImate the udld UISLITbution.
Transcribed Image Text:40
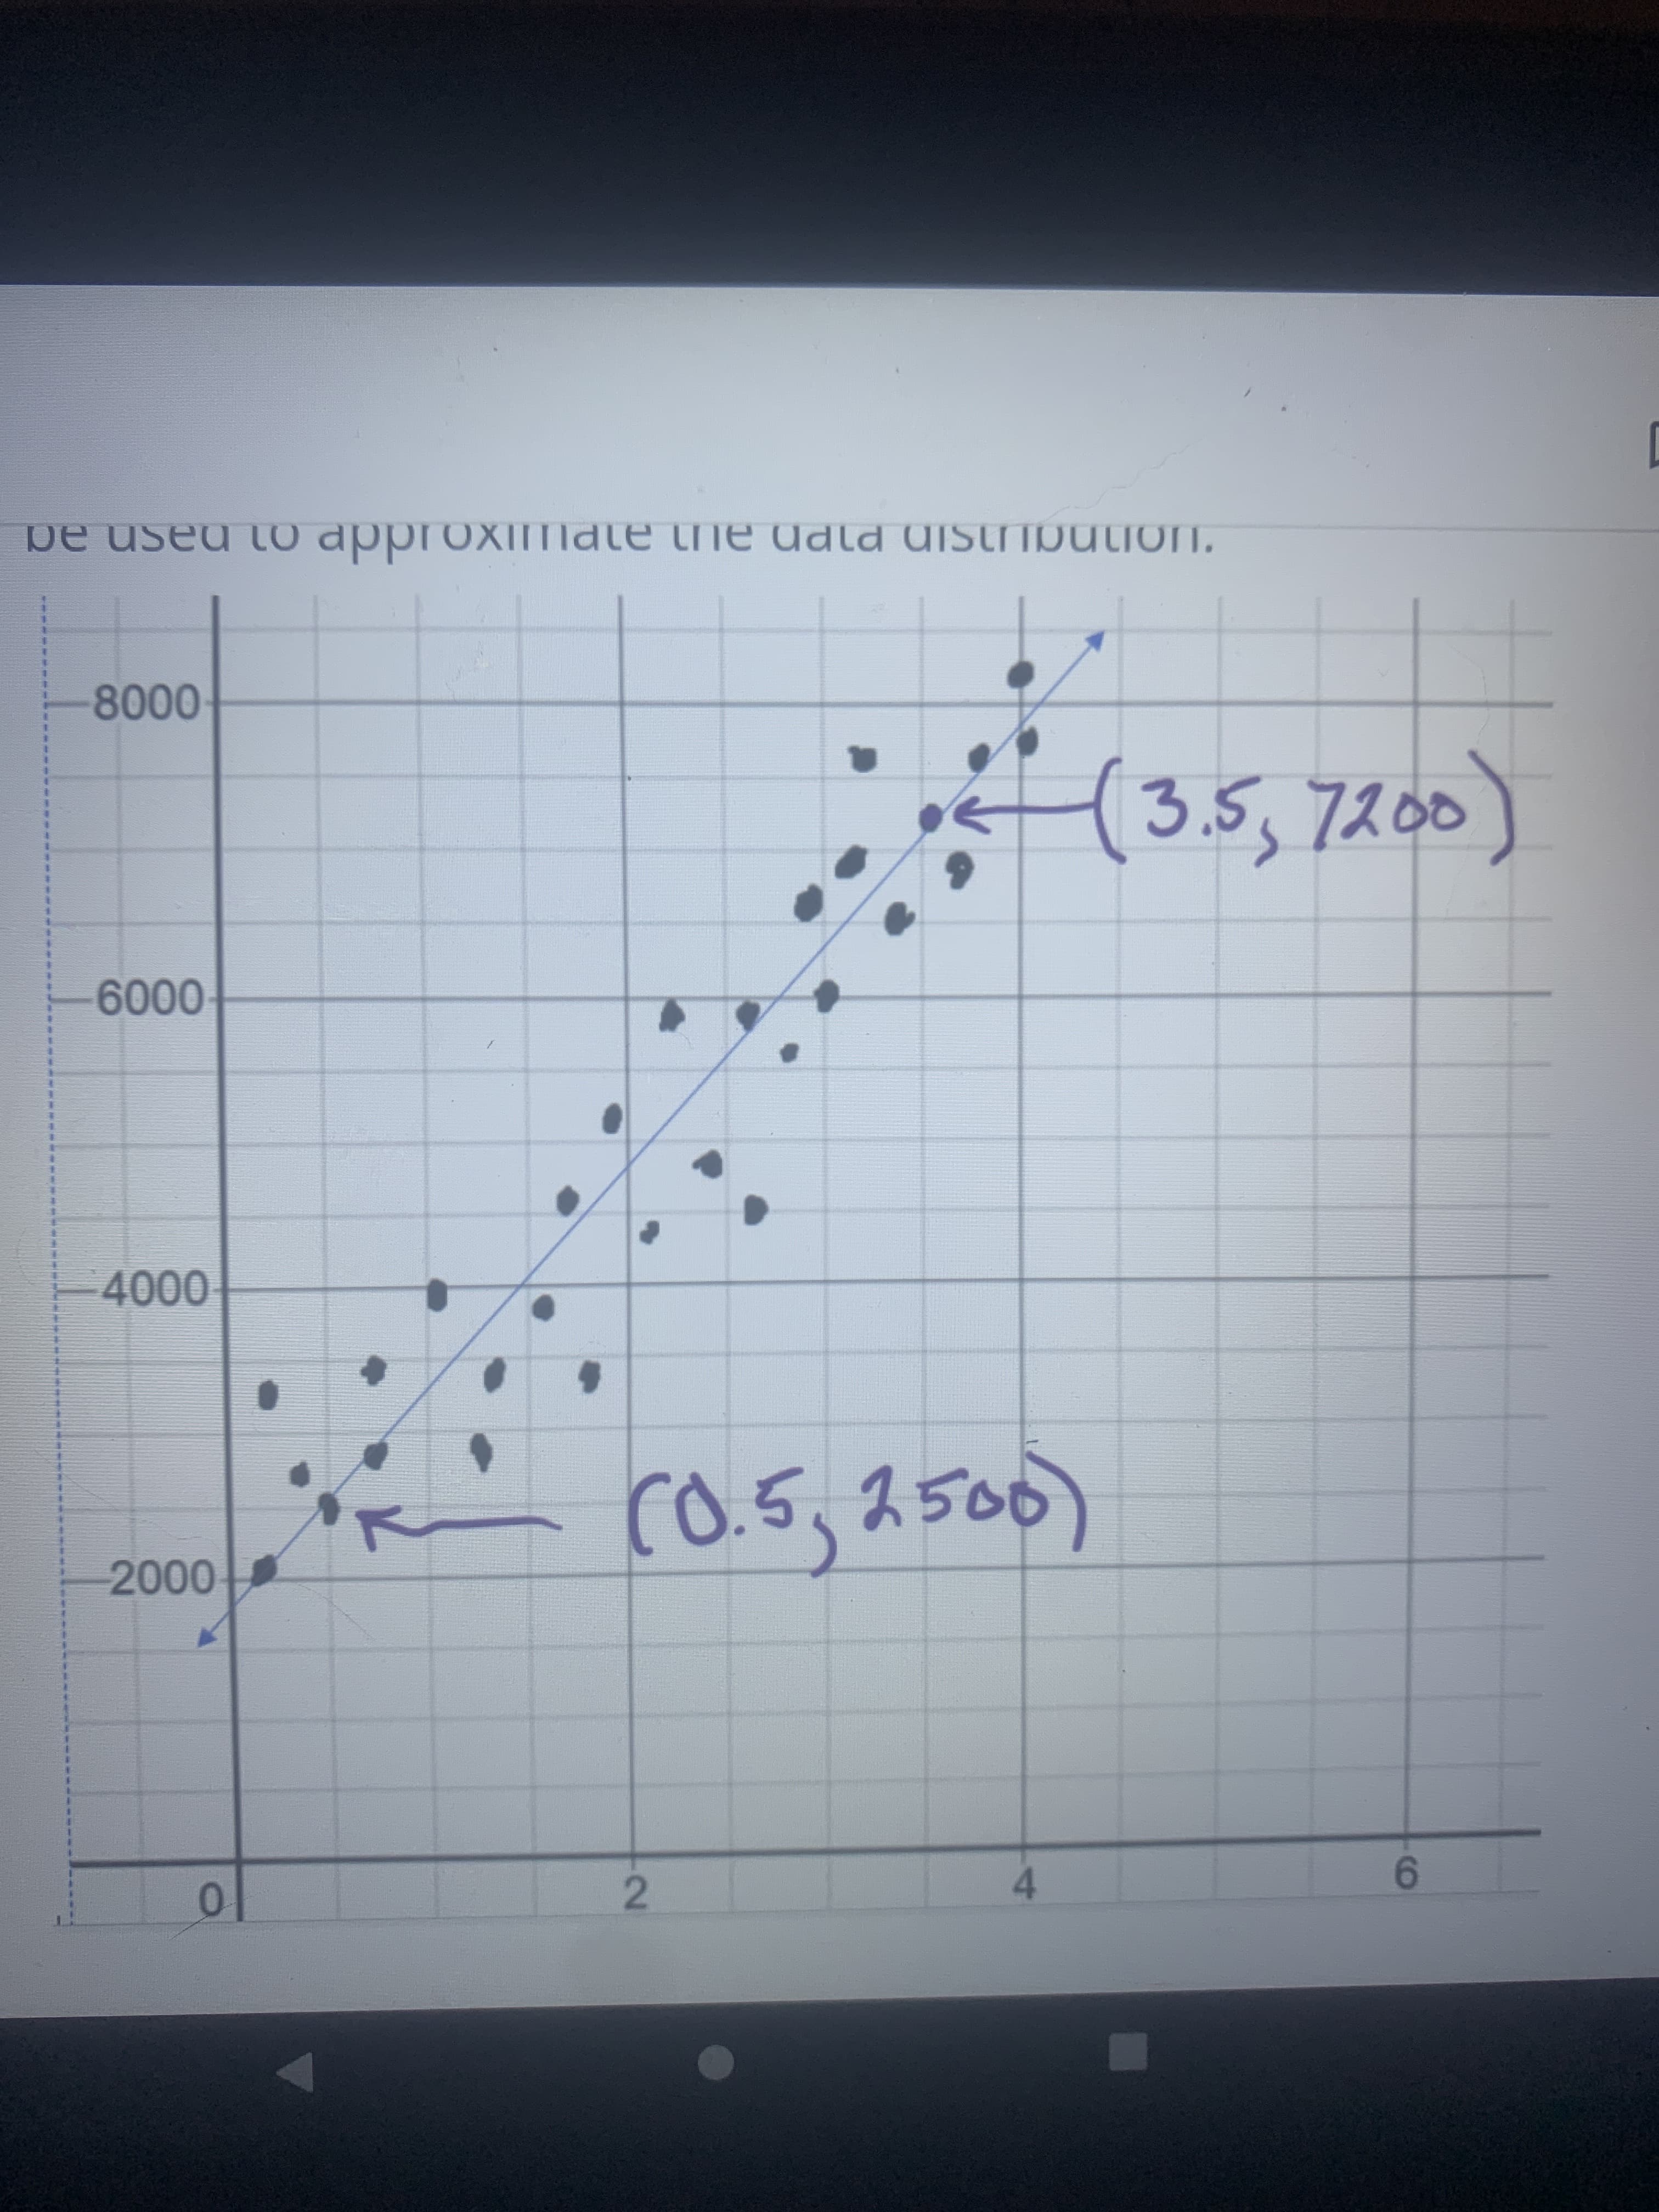
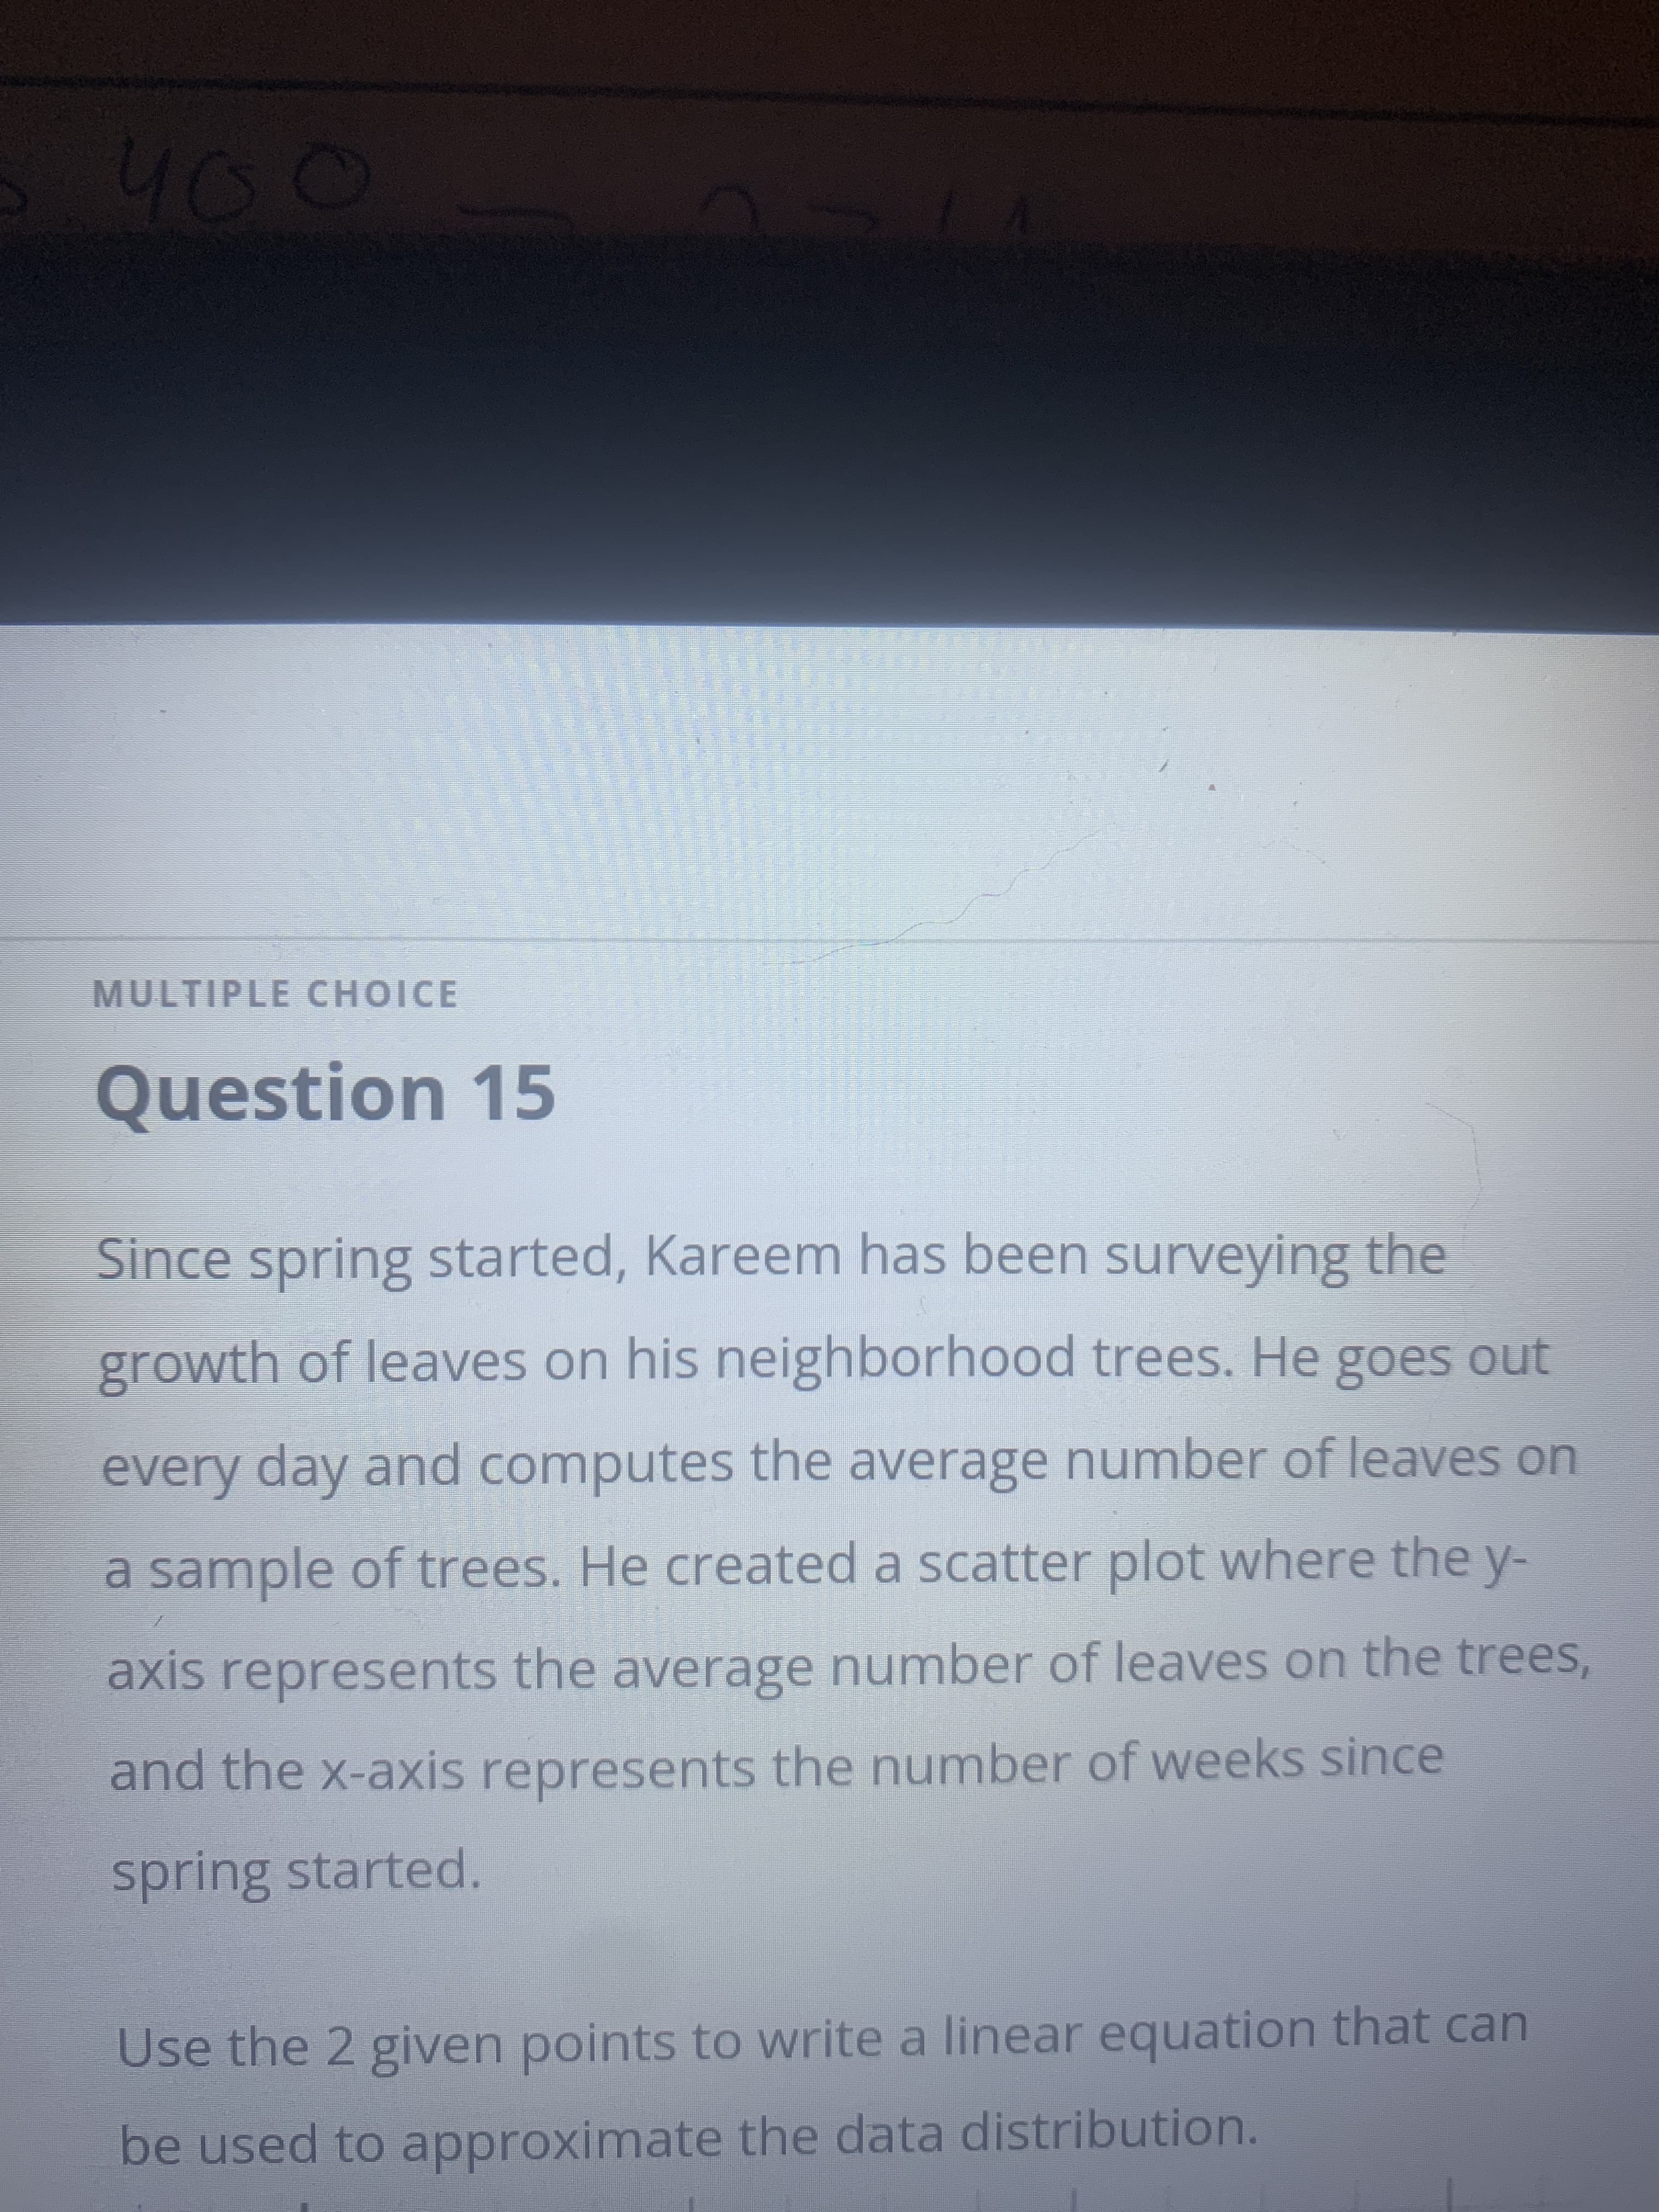
MULTIPLE CHOICE
Question 15
Since spring started, Kareem has been surveying the
growth of leaves on his neighborhood trees. He goes out
every day and computes the average number of leaves on
a sample of trees. He created a scatter plot where the y-
axis represents the average number of leaves on the trees,
and the x-axis represents the number of weeks since
spring started.
Use the 2 given points to write a linear equation that can
be used to approximate the data distribution.
Expert Solution
This question has been solved!
Explore an expertly crafted, step-by-step solution for a thorough understanding of key concepts.

This is a popular solution!

Trending now
This is a popular solution!

Step by step
Solved in 2 steps with 2 images

Follow-up Questions
Read through expert solutions to related follow-up questions below.
Follow-up Question
Based on the equation that was created to, what would be the expected average number of leaves on a tree eight weeks after spring has started?
Solution
Recommended textbooks for you

Glencoe Algebra 1, Student Edition, 9780079039897…
Algebra
ISBN:
9780079039897
Author:
Carter
Publisher:
McGraw Hill

Trigonometry (MindTap Course List)
Trigonometry
ISBN:
9781337278461
Author:
Ron Larson
Publisher:
Cengage Learning
Glencoe Algebra 1, Student Edition, 9780079039897…
Algebra
ISBN:
9780079039897
Author:
Carter
Publisher:
McGraw Hill
Trigonometry (MindTap Course List)
Trigonometry
ISBN:
9781337278461
Author:
Ron Larson
Publisher:
Cengage Learning

Algebra and Trigonometry (MindTap Course List)
Algebra
ISBN:
9781305071742
Author:
James Stewart, Lothar Redlin, Saleem Watson
Publisher:
Cengage Learning

Intermediate Algebra
Algebra
ISBN:
9781285195728
Author:
Jerome E. Kaufmann, Karen L. Schwitters
Publisher:
Cengage Learning

Elementary Algebra
Algebra
ISBN:
9780998625713
Author:
Lynn Marecek, MaryAnne Anthony-Smith
Publisher:
OpenStax - Rice University