It gives a range of values within which the parameter value possibly falls. Interval Sampling O b. Range Estimation O c. Confidence Interval Od. Point Estimate The shape of the T-distribution curve is wider than the normal curve because O a it has higher variance Ob. the mean is also located at the end of the curve it has more sample size Od. the curve is represented by degrees of freedom T-distribution is used when the sample standard deviation is given and the population size is less than 30 Ob. the population standard deviation is unknown and the sample size is greater than 30 O c. the sample size is greater than 30 and the population variance is known O d. the population standard variance is unknown and the sample size is less than 30
It gives a range of values within which the parameter value possibly falls. Interval Sampling O b. Range Estimation O c. Confidence Interval Od. Point Estimate The shape of the T-distribution curve is wider than the normal curve because O a it has higher variance Ob. the mean is also located at the end of the curve it has more sample size Od. the curve is represented by degrees of freedom T-distribution is used when the sample standard deviation is given and the population size is less than 30 Ob. the population standard deviation is unknown and the sample size is greater than 30 O c. the sample size is greater than 30 and the population variance is known O d. the population standard variance is unknown and the sample size is less than 30

MATLAB: An Introduction with Applications
6th Edition
ISBN:9781119256830
Author:Amos Gilat
Publisher:Amos Gilat
Chapter1: Starting With Matlab
Section: Chapter Questions
Problem 1P

Related questions
Question
100%
1,2,3 answer all of themmm
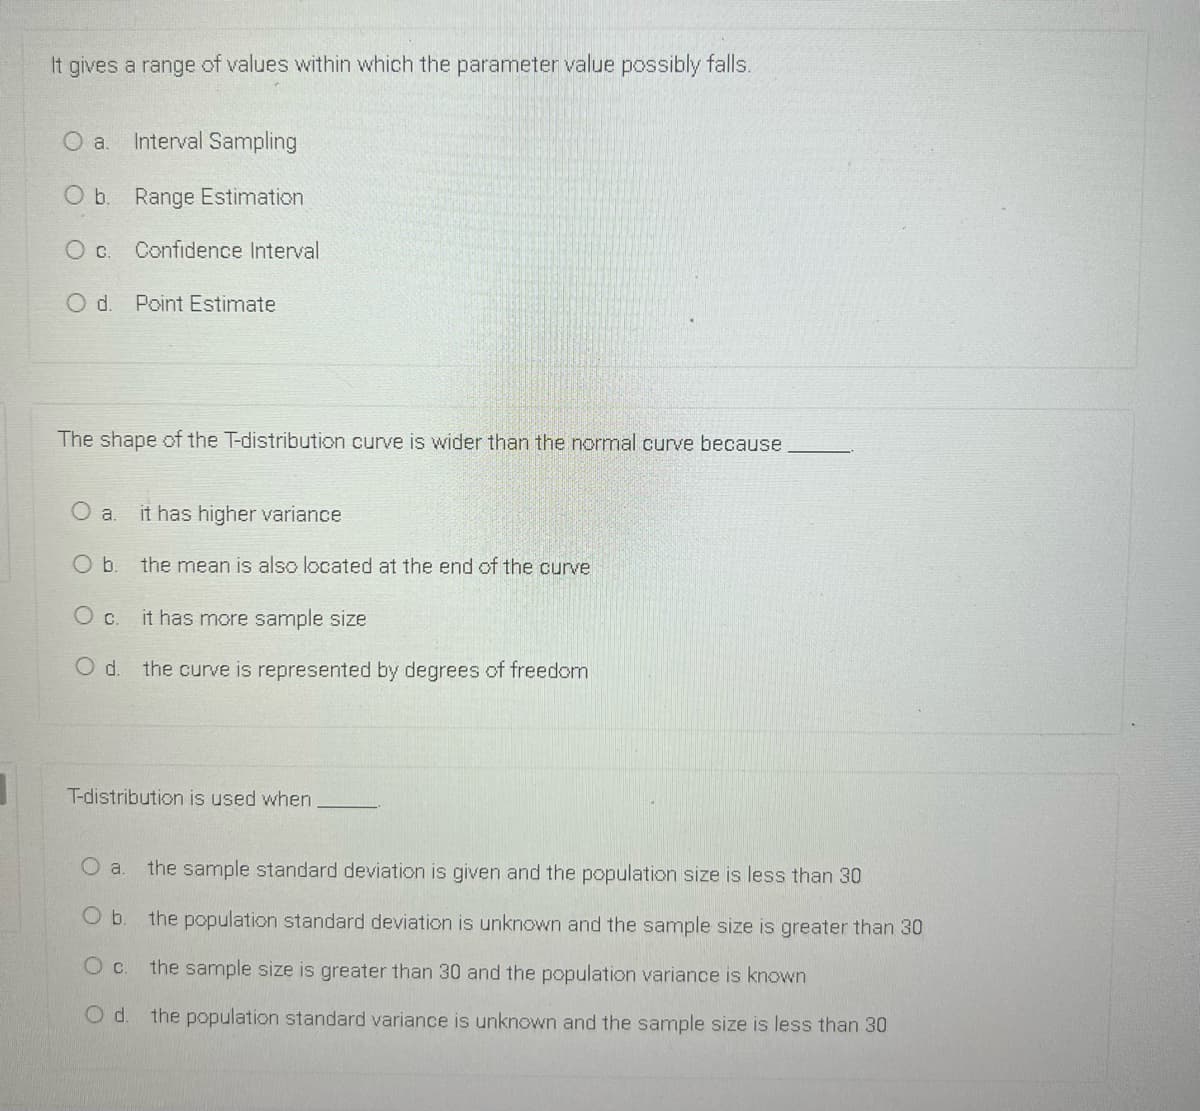
Transcribed Image Text:It gives a range of values within which the parameter value possibly falls.
Interval Sampling
O b. Range Estimation
O c. Confidence Interval
Od.
Point Estimate
The shape of the T-distribution curve is wider than the normal curve because
it has higher variance
Ob.
the mean is also located at the end of the curve
Oc.
it has more sample size
the curve is represented by degrees of freedom
T-distribution is used when
O a.
the sample standard deviation is given and the population size is less than 30
Ob.
the population standard deviation is unknown and the sample size is greater than 30
the sample size is greater than 30 and the population variance is known
the population standard variance is unknown and the sample size is less than 30
Expert Solution
This question has been solved!
Explore an expertly crafted, step-by-step solution for a thorough understanding of key concepts.

Step by step
Solved in 2 steps

Recommended textbooks for you
MATLAB: An Introduction with Applications
Statistics
ISBN:
9781119256830
Author:
Amos Gilat
Publisher:
John Wiley & Sons Inc

Probability and Statistics for Engineering and th…
Statistics
ISBN:
9781305251809
Author:
Jay L. Devore
Publisher:
Cengage Learning

Statistics for The Behavioral Sciences (MindTap C…
Statistics
ISBN:
9781305504912
Author:
Frederick J Gravetter, Larry B. Wallnau
Publisher:
Cengage Learning
MATLAB: An Introduction with Applications
Statistics
ISBN:
9781119256830
Author:
Amos Gilat
Publisher:
John Wiley & Sons Inc
Probability and Statistics for Engineering and th…
Statistics
ISBN:
9781305251809
Author:
Jay L. Devore
Publisher:
Cengage Learning
Statistics for The Behavioral Sciences (MindTap C…
Statistics
ISBN:
9781305504912
Author:
Frederick J Gravetter, Larry B. Wallnau
Publisher:
Cengage Learning

Elementary Statistics: Picturing the World (7th E…
Statistics
ISBN:
9780134683416
Author:
Ron Larson, Betsy Farber
Publisher:
PEARSON

The Basic Practice of Statistics
Statistics
ISBN:
9781319042578
Author:
David S. Moore, William I. Notz, Michael A. Fligner
Publisher:
W. H. Freeman

Introduction to the Practice of Statistics
Statistics
ISBN:
9781319013387
Author:
David S. Moore, George P. McCabe, Bruce A. Craig
Publisher:
W. H. Freeman