Beachcomber Ltd in a local car dealership that sells used and new vehicles. The manager of the company wants to know how different variables affect the sales of his vehicles. A random sample of yearly data was taken with the view to testing the model: SALĖS-a+BAGE+yMIL+8ENG Where SALES= amount that a vehicle is sold for($000's), AGE = age of the vehicle, MIL= the total mileage of the vehicle at the point of sale and ENG = the size of the engine. The sample of data was processed using MINITAB and the following is an extract of the output obtained: The regression equation is ***** redictor onstant GE IL NG Coef StDev t-ratio p-value 0.0000 0.5042 1.7586 0.2525 6.9648 0.2124 0.3175 -0.7527 0.3586 -2.0991 4.8124 0.6196 7.7664 0.0000 Analysis of Variance ource egression rror otal DF s MS F P 0.00 3 413.1291 138.7097 50 457.7607 2.2888 53 a) What is dependent and independent variables? b) Fully write out the regression equation c) Fill in the missing values ***, ***, and * d) Hence test whether 8 is significant. Give reasons for your answer. e) Perform the F Test making sure to state the null and alternative hypothesis. f) Given an interpretation of the term “R-sq" and comment on its value.
Beachcomber Ltd in a local car dealership that sells used and new vehicles. The manager of the company wants to know how different variables affect the sales of his vehicles. A random sample of yearly data was taken with the view to testing the model: SALĖS-a+BAGE+yMIL+8ENG Where SALES= amount that a vehicle is sold for($000's), AGE = age of the vehicle, MIL= the total mileage of the vehicle at the point of sale and ENG = the size of the engine. The sample of data was processed using MINITAB and the following is an extract of the output obtained: The regression equation is ***** redictor onstant GE IL NG Coef StDev t-ratio p-value 0.0000 0.5042 1.7586 0.2525 6.9648 0.2124 0.3175 -0.7527 0.3586 -2.0991 4.8124 0.6196 7.7664 0.0000 Analysis of Variance ource egression rror otal DF s MS F P 0.00 3 413.1291 138.7097 50 457.7607 2.2888 53 a) What is dependent and independent variables? b) Fully write out the regression equation c) Fill in the missing values ***, ***, and * d) Hence test whether 8 is significant. Give reasons for your answer. e) Perform the F Test making sure to state the null and alternative hypothesis. f) Given an interpretation of the term “R-sq" and comment on its value.

College Algebra
7th Edition
ISBN:9781305115545
Author:James Stewart, Lothar Redlin, Saleem Watson
Publisher:James Stewart, Lothar Redlin, Saleem Watson
Chapter1: Equations And Graphs
Section: Chapter Questions
Problem 10T: Olympic Pole Vault The graph in Figure 7 indicates that in recent years the winning Olympic men’s...

Related questions

Topic Video
Question
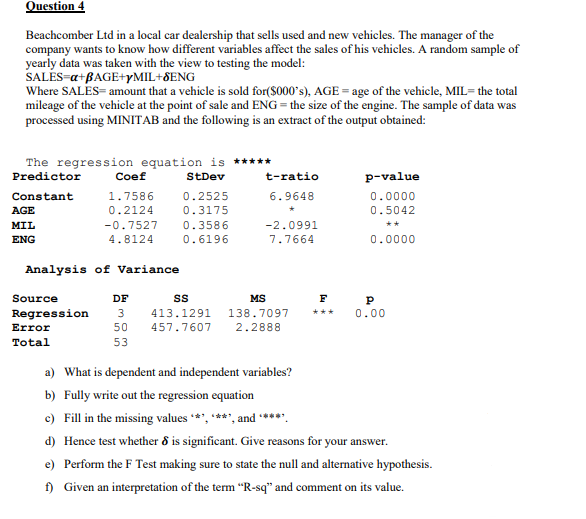
Transcribed Image Text:Question 4
Beachcomber Ltd in a local car dealership that sells used and new vehicles. The manager of the
company wants to know how different variables affect the sales of his vehicles. A random sample of
yearly data was taken with the view to testing the model:
SALĖS-a+BAGE+YMIL+8ENG
Where SALES= amount that a vehicle is sold for($000's), AGE = age of the vehicle, MIL= the total
mileage of the vehicle at the point of sale and ENG = the size of the engine. The sample of data was
processed using MINITAB and the following is an extract of the output obtained:
The regression equation is *****
Predictor
Coef
StDev
t-ratio
p-value
Constant
1.7586
0.2525
6.9648
0.0000
AGE
0.2124
0.3175
0.5042
MIL
-0.7527
0.3586
-2.0991
ENG
4.8124
0.6196
7.7664
0.0000
Analysis of Variance
Source
DF
MS
F
Regression
3
413.1291
138.7097
+**
0.00
Error
50
457.7607
2.2888
Total
53
a) What is dependent and independent variables?
b) Fully write out the regression equation
c) Fill in the missing values ***, ****, and **
d) Hence test whether 8 is significant. Give reasons for your answer.
e) Perform the F Test making sure to state the null and alternative hypothesis.
f) Given an interpretation of the term "R-sq" and comment on its value.
Expert Solution
This question has been solved!
Explore an expertly crafted, step-by-step solution for a thorough understanding of key concepts.

Step by step
Solved in 2 steps

Knowledge Booster


Learn more about
Need a deep-dive on the concept behind this application? Look no further. Learn more about this topic, statistics and related others by exploring similar questions and additional content below.Recommended textbooks for you
College Algebra
Algebra
ISBN:
9781305115545
Author:
James Stewart, Lothar Redlin, Saleem Watson
Publisher:
Cengage Learning

Functions and Change: A Modeling Approach to Coll…
Algebra
ISBN:
9781337111348
Author:
Bruce Crauder, Benny Evans, Alan Noell
Publisher:
Cengage Learning

Linear Algebra: A Modern Introduction
Algebra
ISBN:
9781285463247
Author:
David Poole
Publisher:
Cengage Learning
College Algebra
Algebra
ISBN:
9781305115545
Author:
James Stewart, Lothar Redlin, Saleem Watson
Publisher:
Cengage Learning
Functions and Change: A Modeling Approach to Coll…
Algebra
ISBN:
9781337111348
Author:
Bruce Crauder, Benny Evans, Alan Noell
Publisher:
Cengage Learning
Linear Algebra: A Modern Introduction
Algebra
ISBN:
9781285463247
Author:
David Poole
Publisher:
Cengage Learning

Big Ideas Math A Bridge To Success Algebra 1: Stu…
Algebra
ISBN:
9781680331141
Author:
HOUGHTON MIFFLIN HARCOURT
Publisher:
Houghton Mifflin Harcourt