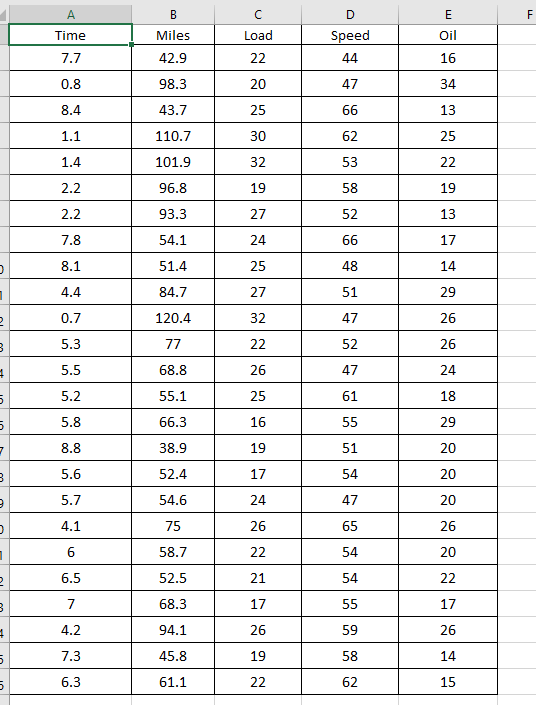
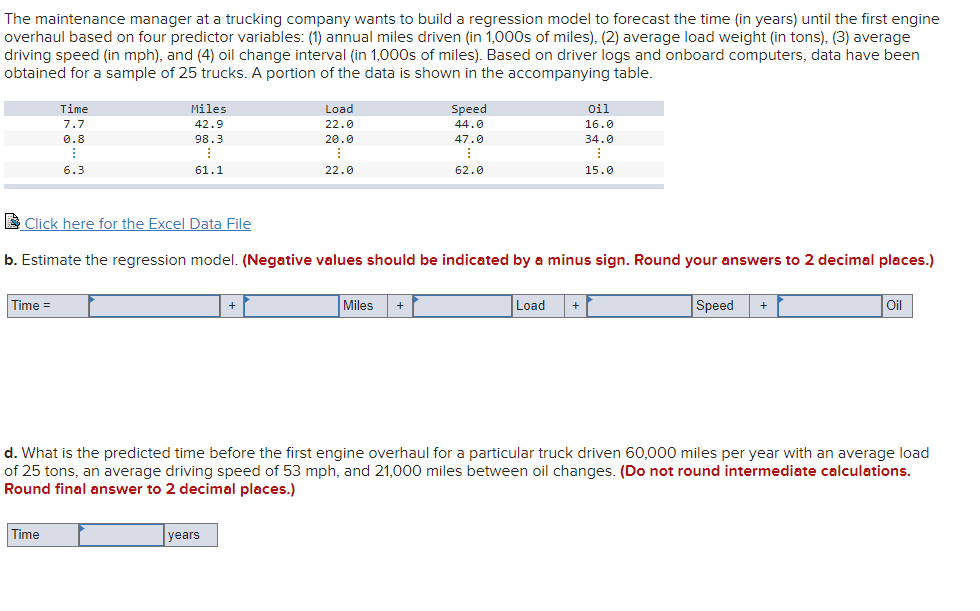
The maintenance manager at a trucking company wants to build a regression model to forecast the time (in years) until the first engine overhaul based on four predictor variables: (1) annual miles driven (in 1,000s of miles), (2) average load weight (in tons), (3) average driving speed (in mph), and (4) oil change interval (in 1,000s of miles). Based on driver logs and onboard computers, data have been obtained for a sample of 25 trucks. A portion of the data is shown in the accompanying table. Time Miles Load Speed Oil


Correlation
Correlation defines a relationship between two independent variables. It tells the degree to which variables move in relation to each other. When two sets of data are related to each other, there is a correlation between them.
Linear Correlation
A correlation is used to determine the relationships between numerical and categorical variables. In other words, it is an indicator of how things are connected to one another. The correlation analysis is the study of how variables are related.
Regression Analysis
Regression analysis is a statistical method in which it estimates the relationship between a dependent variable and one or more independent variable. In simple terms dependent variable is called as outcome variable and independent variable is called as predictors. Regression analysis is one of the methods to find the trends in data. The independent variable used in Regression analysis is named Predictor variable. It offers data of an associated dependent variable regarding a particular outcome.


Trending now
This is a popular solution!

Step by step
Solved in 3 steps with 2 images

At the 10% significance level, are the predictor variables jointly significant?


