Because colas tend to replace healthier beverages and colas contain caffeine and phosphoric acid, researchers wanted to know whether cola consumption is associated with lower bone mineral density in women. The accompanying data lists typical number of cans of cola consumed in a week and the femoral neck bone mineral density for a sample of 15 women. Complete parts (a) through (f) below. E Click the icon to view the women's data. (a) Find the least-squares regression line treating cola consumption per week as the explanatory variable. Colas per week and bone density (Round to four decimal places as needed.) (b) Interpret the slope. Select the correct choice below and, if necessary, fill in the answer box to complete your choice. colas per week Bone Mineral Density (g/cm) - 0.906 O A. For every unit increase in bone density, the number of colas decreases by. on average. (Round to four decimal places as needed.) 0.874 0.886 Question Viewe OB. O B. For 0 colas consumed in a week, the bone density is predicted to be 2 g/cm. 0.853 (Round to four decimal places as needed.) 2 0.864 2 0.847 OC. For a bone density of 0 g/cm, the number of colas consumed is predicted to be . 0.846 (Round to four decimal places as needed.) 0.832 O D. For every additional cola consumed per week, the bone density decreases by g/cm, on average. 4 0.810 (Round to four decimal places as needed.) 0.793 OE. It is not appropriate to interpret the slope. 0.789 0.788 (c) Interpret the intercept. Select the correct choice below and, if necessary, fill in the answer box to complete your choice. 0.763 7 0.752 OA For every unit increase in bone density, the number of colas decreases by (Round to four decimal places as needed.) O B. For a bone density of 0 g/cm, the number of colas consumed is predicted to be (Round to four decimal places as needed.) . on average. 8. 0.725 in O C. For every additional cola consumed per week, the bone density decreases by g/cm, on average. Print Done (Round to four decimal places as needed.)
Because colas tend to replace healthier beverages and colas contain caffeine and phosphoric acid, researchers wanted to know whether cola consumption is associated with lower bone mineral density in women. The accompanying data lists typical number of cans of cola consumed in a week and the femoral neck bone mineral density for a sample of 15 women. Complete parts (a) through (f) below. E Click the icon to view the women's data. (a) Find the least-squares regression line treating cola consumption per week as the explanatory variable. Colas per week and bone density (Round to four decimal places as needed.) (b) Interpret the slope. Select the correct choice below and, if necessary, fill in the answer box to complete your choice. colas per week Bone Mineral Density (g/cm) - 0.906 O A. For every unit increase in bone density, the number of colas decreases by. on average. (Round to four decimal places as needed.) 0.874 0.886 Question Viewe OB. O B. For 0 colas consumed in a week, the bone density is predicted to be 2 g/cm. 0.853 (Round to four decimal places as needed.) 2 0.864 2 0.847 OC. For a bone density of 0 g/cm, the number of colas consumed is predicted to be . 0.846 (Round to four decimal places as needed.) 0.832 O D. For every additional cola consumed per week, the bone density decreases by g/cm, on average. 4 0.810 (Round to four decimal places as needed.) 0.793 OE. It is not appropriate to interpret the slope. 0.789 0.788 (c) Interpret the intercept. Select the correct choice below and, if necessary, fill in the answer box to complete your choice. 0.763 7 0.752 OA For every unit increase in bone density, the number of colas decreases by (Round to four decimal places as needed.) O B. For a bone density of 0 g/cm, the number of colas consumed is predicted to be (Round to four decimal places as needed.) . on average. 8. 0.725 in O C. For every additional cola consumed per week, the bone density decreases by g/cm, on average. Print Done (Round to four decimal places as needed.)

Glencoe Algebra 1, Student Edition, 9780079039897, 0079039898, 2018
18th Edition
ISBN:9780079039897
Author:Carter
Publisher:Carter
Chapter4: Equations Of Linear Functions
Section4.5: Correlation And Causation
Problem 11PPS

Related questions
Question
Transcribed Image Text:Because colas tend to replace healthier beverages and colas contain caffeine and phosphoric acid, researchers wanted to know whether cola consumption is associated with lower bone mineral density in women. The accompanying data lists the
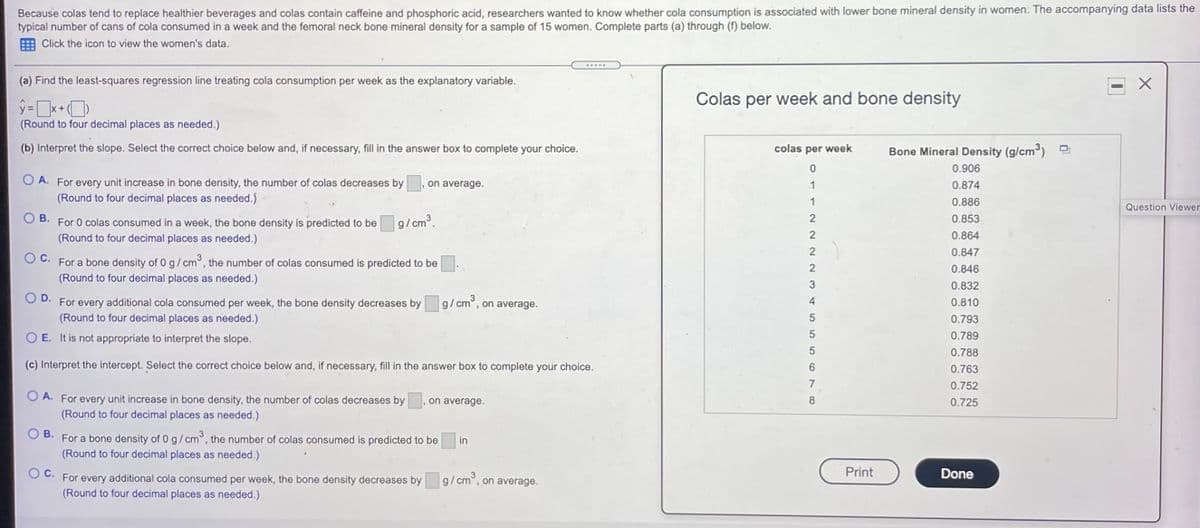
typical number of cans of cola consumed in a week and the femoral neck bone mineral density for a sample of 15 women. Complete parts (a) through (f) below.
E Click the icon to view the women's data.
.....
(a) Find the least-squares regression line treating cola consumption per week as the explanatory variable.
Colas per week and bone density
(Round to four decimal places as needed.)
(b) Interpret the slope. Select the correct choice below and, if necessary, fill in the answer box to complete your choice.
colas per week
Bone Mineral Density (g/cm)
0.906
O A. For every unit increase in bone density, the number of colas decreases by
(Round to four decimal places as needed.)
on average.
1
0.874
1
0.886
Question Viewer
В.
0.853
For 0 colas consumed in a week, the bone density is predicted to be
(Round to four decimal places as needed.)
g/cm3.
0.864
0.847
Oc.
For a bone density of 0 g/cm°, the number of colas consumed is predicted to be
(Round to four decimal places as needed.)
0.846
0.832
D.
For every additional cola consumed per week, the bone density decreases by g/cm°, on average.
(Round to four decimal places as needed.)
4
0.810
0.793
O E. It is not appropriate to interpret the slope.
0.789
0.788
(c) Interpret the intercept. Select the correct choice below and, if necessary, fill in the answer box to complete your choice.
0.763
7
0.752
O A. For every unit increase in bone density, the number of colas decreases by.
(Round to four decimal places as needed.)
on average.
8.
0.725
В.
For a bone density of 0 g/cm°, the number of colas consumed is predicted to be
(Round to four decimal places as needed.)
in
Oc.
Print
Done
every additional cola consumed per week, the bone density decreases by g/cm°, on average.
(Round to four decimal places as needed.)
For
Transcribed Image Text:Because colas tend to replace healthier beverages and colas contain caffeine and phosphoric acid, researchers wanted to know whether cola consumption is associated with lower bone mineral density in women. The accompanying data lists
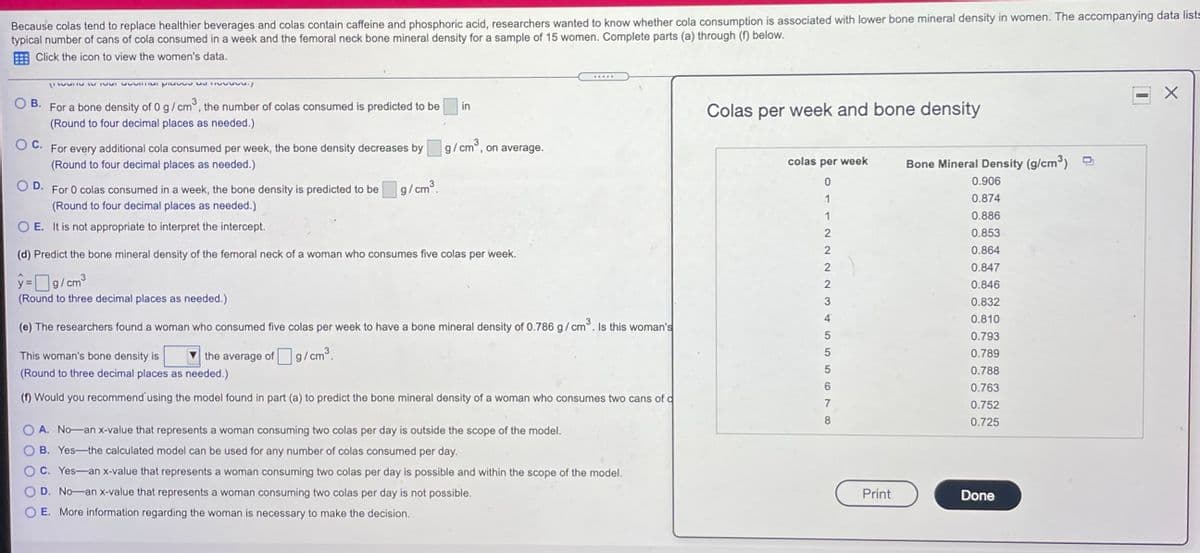
typical number of cans of cola consumed in a week and the femoral neck bone mineral density for a sample of 15 women. Complete parts (a) through (f) below.
E Click the icon to view the women's data.
В.
For a bone density of 0 g/cm°, the number of colas consumed is predicted to be
in
Colas per week and bone density
(Round to four decimal places as needed.)
O C. For every additional cola consumed per week, the bone density decreases by g/cm°, on average.
(Round to four decimal places as needed.)
colas per week
Bone Mineral Density (g/cm) -
0.906
D.
For 0 colas consumed in a week, the bone density is predicted to be
g/cm3.
0.874
(Round to four decimal places as needed.)
0.886
O E. It is not appropriate to interpret the intercept.
0.853
0.864
(d) Predict the bone mineral density of the femoral neck of a woman who consumes five colas per week.
0.847
y=g/cm
3
0.846
(Round to three decimal places as needed.)
0.832
0.810
(e) The researchers found a woman who consumed five colas per week to have a bone mineral density of 0.786 g/cm°. Is this woman's
0.793
This woman's bone density is
the average of g/cm°.
0.789
(Round to three decimal places as needed.)
0.788
0.763
(f) Would you recommend' using the model found in part (a) to predict the bone mineral density of a woman who consumes two cans of d
7
0.752
0.725
A. No-an x-value that represents a woman consuming two colas per day is outside the scope of the model.
B. Yes-the calculated model can be used for any number of colas consumed per day.
C. Yes-an x-value that represents a woman consuming two colas per day is possible and within the scope of the model.
D. No-an x-value that represents a woman consuming two colas per day is not possible.
Print
Done
E. More information regarding the woman is necessary to make the decision.
o11 2222N 345 556 NO
O O
Expert Solution
This question has been solved!
Explore an expertly crafted, step-by-step solution for a thorough understanding of key concepts.

This is a popular solution!

Trending now
This is a popular solution!

Step by step
Solved in 4 steps

Recommended textbooks for you
Glencoe Algebra 1, Student Edition, 9780079039897…
Algebra
ISBN:
9780079039897
Author:
Carter
Publisher:
McGraw Hill

Holt Mcdougal Larson Pre-algebra: Student Edition…
Algebra
ISBN:
9780547587776
Author:
HOLT MCDOUGAL
Publisher:
HOLT MCDOUGAL

Big Ideas Math A Bridge To Success Algebra 1: Stu…
Algebra
ISBN:
9781680331141
Author:
HOUGHTON MIFFLIN HARCOURT
Publisher:
Houghton Mifflin Harcourt
Glencoe Algebra 1, Student Edition, 9780079039897…
Algebra
ISBN:
9780079039897
Author:
Carter
Publisher:
McGraw Hill
Holt Mcdougal Larson Pre-algebra: Student Edition…
Algebra
ISBN:
9780547587776
Author:
HOLT MCDOUGAL
Publisher:
HOLT MCDOUGAL
Big Ideas Math A Bridge To Success Algebra 1: Stu…
Algebra
ISBN:
9781680331141
Author:
HOUGHTON MIFFLIN HARCOURT
Publisher:
Houghton Mifflin Harcourt