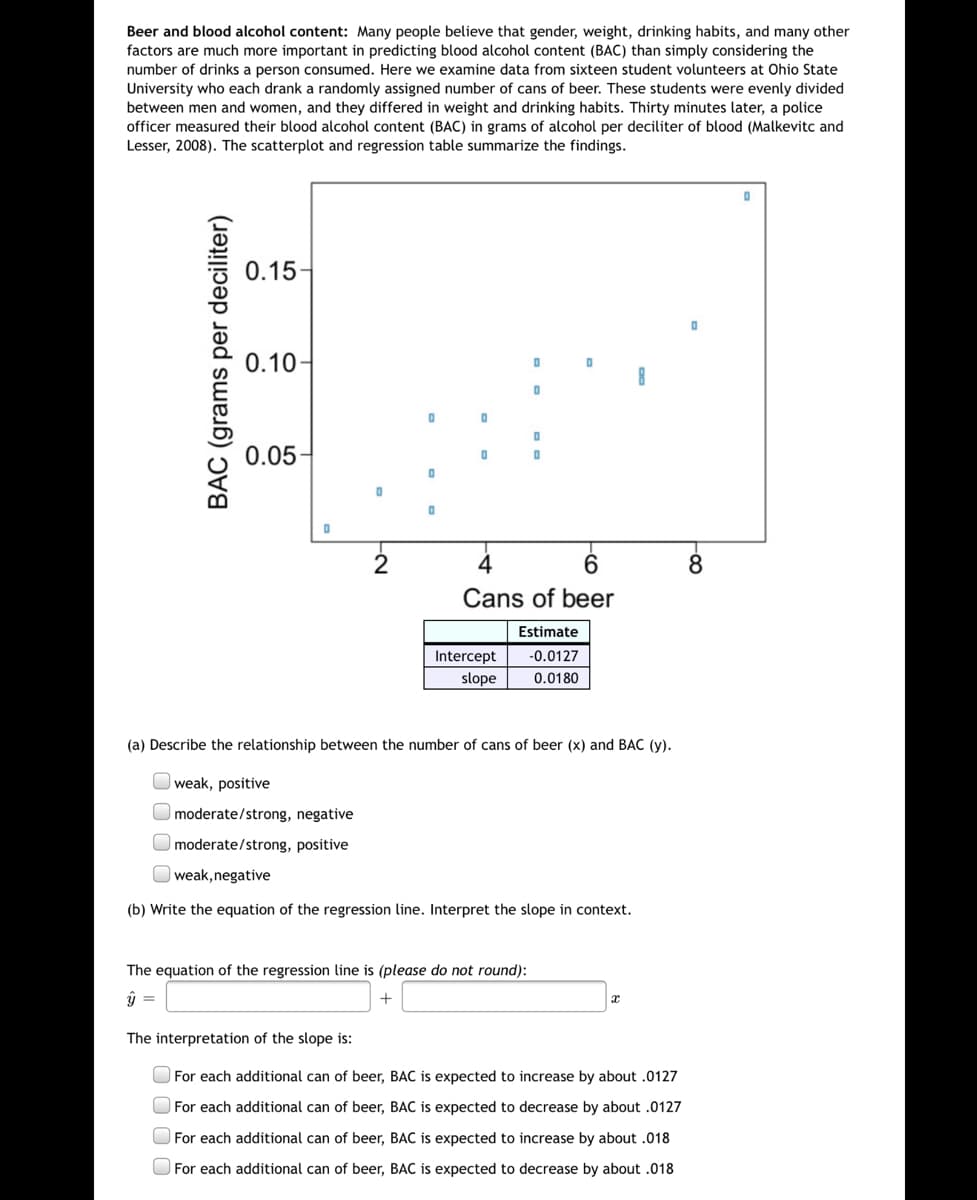
Beer and blood alcohol content: Many people believe that gender, weight, drinking habits, and many other factors are much more important in predicting blood alcohol content (BAC) than simply considering the number of drinks a person consumed. Here we examine data from sixteen student volunteers at Ohio State University who each drank a randomly assigned number of cans of beer. These students were evenly divided between men and women, and they differed in weight and drinking habits. Thirty minutes later, a police officer measured their blood alcohol content (BAC) in grams of alcohol per deciliter of blood (Malkevitc and Lesser, 2008). The scatterplot and regression table summarize the findings. 0.15 0.10 0.05 4 6. 8. Cans of beer Estimate Intercept -0.0127 slope 0.0180 (a) Describe the relationship between the number of cans of beer (x) and BAC (y). Oweak, positive moderate/strong, negative moderate/strong, positive weak,negative (b) Write the equation of the regression line. Interpret the slope in context. The equation of the regression line is (please do not round): = The interpretation of the slope is: For each additional can of beer, BAC is expected to increase by about .0127 For each additional can of beer, BAC is expected to decrease by about .0127 For each additional can of beer, BAC is expected to increase by about .018 O For each additional can of beer, BAC is expected to decrease by about .018 BAC (grams per deciliter)


Addition Rule of Probability
It simply refers to the likelihood of an event taking place whenever the occurrence of an event is uncertain. The probability of a single event can be calculated by dividing the number of successful trials of that event by the total number of trials.
Expected Value
When a large number of trials are performed for any random variable ‘X’, the predicted result is most likely the mean of all the outcomes for the random variable and it is known as expected value also known as expectation. The expected value, also known as the expectation, is denoted by: E(X).
Probability Distributions
Understanding probability is necessary to know the probability distributions. In statistics, probability is how the uncertainty of an event is measured. This event can be anything. The most common examples include tossing a coin, rolling a die, or choosing a card. Each of these events has multiple possibilities. Every such possibility is measured with the help of probability. To be more precise, the probability is used for calculating the occurrence of events that may or may not happen. Probability does not give sure results. Unless the probability of any event is 1, the different outcomes may or may not happen in real life, regardless of how less or how more their probability is.
Basic Probability
The simple definition of probability it is a chance of the occurrence of an event. It is defined in numerical form and the probability value is between 0 to 1. The probability value 0 indicates that there is no chance of that event occurring and the probability value 1 indicates that the event will occur. Sum of the probability value must be 1. The probability value is never a negative number. If it happens, then recheck the calculation.


Trending now
This is a popular solution!

Step by step
Solved in 2 steps


