Insurance (Life Expectancy). Insurance companies base their premiums on many factors, but basically all the factors are variables that predict life expectancy. Life expectancy varies from place to place. The following variables are from a data set on various measures obtained from the 50 US states (around 2009) Murder: rate per 100,000 HS Graduation: recorded as a percentage Income: per capita income in dollars Illiteracy: rate per 1,000 Life Expectancy: recorded in years 2008 Electoral vote state color: red / blue State electoral vote color coded: red = 1 / blue = 0 Multiple linear regression results: See Attachments please Write the multiple linear regression equation, use this equation to predict the Life expectancy for Pennsylvania and calculate the residual. Data: State Name Life Expectancy Murder HS Grad Income Illiteracy ColorCode Color Alabama 69.05 15.1 41.3 3624 2.1 1 red Alaska 69.31 11.3 66.7 6315 1.5 1 red Arizona 70.55 7.8 58.1 4530 1.8 1 red Arkansas 70.66 10.1 39.9 3378 1.9 1 red California 71.71 10.3 62.6 5114 1.1 0 blue Colorado 72.06 6.8 63.9 4884 0.7 0 blue Connecticut 72.48 3.1 56 5348 1.1 0 blue Delaware 70.06 6.2 54.6 4809 0.9 0 blue Florida 70.66 10.7 52.6 4815 1.3 0 blue Georgia 68.54 13.9 40.6 4091 2 1 red Hawaii 73.6 6.2 61.9 4963 1.9 0 blue Idaho 71.87 5.3 59.5 4119 0.6 1 red Illinois 70.14 10.3 52.6 5107 0.9 0 blue Indiana 70.88 7.1 52.9 4458 0.7 1 red Iowa 72.56 2.3 59 4628 0.5 0 blue Kansas 72.58 4.5 59.9 4669 0.6 1 red Kentucky 70.1 10.6 38.5 3712 1.6 1 red Louisiana 68.76 13.2 42.2 3545 2.8 1 red Maine 70.39 2.7 54.7 3694 0.7 0 blue Maryland 70.22 8.5 52.3 5299 0.9 0 blue Massachusetts 71.83 3.3 58.5 4755 1.1 0 blue Michigan 70.63 11.1 52.8 4751 0.9 0 blue Minnesota 72.96 2.3 57.6 4675 0.6 0 blue Mississippi 68.09 12.5 41 3098 2.4 1 red Missouri 70.69 9.3 48.8 4254 0.8 1 red Montana 70.56 5 59.2 4347 0.6 1 red Nebraska 72.6 2.9 59.3 4508 0.6 1 red Nevada 69.03 11.5 65.2 5149 0.5 0 blue NewHampshire 71.23 3.3 57.6 4281 0.7 0 blue NewJersey 70.93 5.2 52.5 5237 1.1 0 blue NewMexico 70.32 9.7 55.2 3601 2.2 0 blue NewYork 70.55 10.9 52.7 4903 1.4 0 blue NorthCarolina 69.21 11.1 38.5 3875 1.8 1 red NorthDakota 72.78 1.4 50.3 5087 0.8 1 red Ohio 70.82 7.4 53.2 4561 0.8 0 blue Oklahoma 71.42 6.4 51.6 3983 1.1 1 red Oregon 72.13 4.2 60 4660 0.6 0 blue Pennsylvania 70.43 6.1 50.2 4449 1 0 blue RhodeIsland 71.9 2.4 46.4 4558 1.3 0 blue SouthCarolina 67.96 11.6 37.8 3635 2.3 1 red SouthDakota 72.08 1.7 53.3 4167 0.5 1 red Tennessee 70.11 11 41.8 3821 1.7 1 red Texas 70.9 12.2 47.4 4188 2.2 1 red Utah 72.9 4.5 67.3 4022 0.6 1 red Vermont 71.64 5.5 57.1 3907 0.6 0 blue Virginia 70.08 9.5 47.8 4701 1.4 0 blue Washington 71.72 4.3 63.5 4864 0.6 0 blue WestVirginia 69.48 6.7 41.6 3617 1.4 1 red Wisconsin 72.48 3 54.5 4468 0.7 0 blue Wyoming 70.29 6.9 62.9 4566 0.6 1 red


Correlation
Correlation defines a relationship between two independent variables. It tells the degree to which variables move in relation to each other. When two sets of data are related to each other, there is a correlation between them.
Linear Correlation
A correlation is used to determine the relationships between numerical and categorical variables. In other words, it is an indicator of how things are connected to one another. The correlation analysis is the study of how variables are related.
Regression Analysis
Regression analysis is a statistical method in which it estimates the relationship between a dependent variable and one or more independent variable. In simple terms dependent variable is called as outcome variable and independent variable is called as predictors. Regression analysis is one of the methods to find the trends in data. The independent variable used in Regression analysis is named Predictor variable. It offers data of an associated dependent variable regarding a particular outcome.
Insurance (Life Expectancy). Insurance companies base their premiums on many factors, but basically all the factors are variables that predict life expectancy. Life expectancy varies from place to place. The following variables are from a data set on various measures obtained from the 50 US states (around 2009)
Murder: rate per 100,000
HS Graduation: recorded as a percentage
Income: per capita income in dollars
Illiteracy: rate per 1,000
Life Expectancy: recorded in years
2008 Electoral vote state color: red / blue
State electoral vote color coded: red = 1 / blue = 0
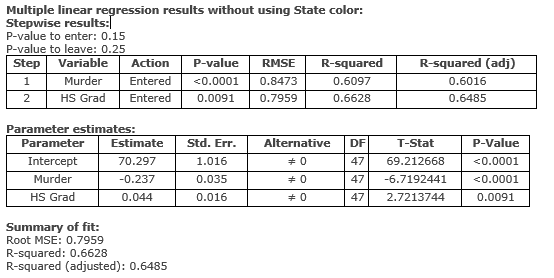
Multiple linear regression results: See Attachments please
Write the multiple linear regression equation, use this equation to predict the Life expectancy for Pennsylvania and calculate the residual.
Data:
| State Name | Life Expectancy | Murder | HS Grad | Income | Illiteracy | ColorCode | Color |
| Alabama | 69.05 | 15.1 | 41.3 | 3624 | 2.1 | 1 | red |
| Alaska | 69.31 | 11.3 | 66.7 | 6315 | 1.5 | 1 | red |
| Arizona | 70.55 | 7.8 | 58.1 | 4530 | 1.8 | 1 | red |
| Arkansas | 70.66 | 10.1 | 39.9 | 3378 | 1.9 | 1 | red |
| California | 71.71 | 10.3 | 62.6 | 5114 | 1.1 | 0 | blue |
| Colorado | 72.06 | 6.8 | 63.9 | 4884 | 0.7 | 0 | blue |
| Connecticut | 72.48 | 3.1 | 56 | 5348 | 1.1 | 0 | blue |
| Delaware | 70.06 | 6.2 | 54.6 | 4809 | 0.9 | 0 | blue |
| Florida | 70.66 | 10.7 | 52.6 | 4815 | 1.3 | 0 | blue |
| Georgia | 68.54 | 13.9 | 40.6 | 4091 | 2 | 1 | red |
| Hawaii | 73.6 | 6.2 | 61.9 | 4963 | 1.9 | 0 | blue |
| Idaho | 71.87 | 5.3 | 59.5 | 4119 | 0.6 | 1 | red |
| Illinois | 70.14 | 10.3 | 52.6 | 5107 | 0.9 | 0 | blue |
| Indiana | 70.88 | 7.1 | 52.9 | 4458 | 0.7 | 1 | red |
| Iowa | 72.56 | 2.3 | 59 | 4628 | 0.5 | 0 | blue |
| Kansas | 72.58 | 4.5 | 59.9 | 4669 | 0.6 | 1 | red |
| Kentucky | 70.1 | 10.6 | 38.5 | 3712 | 1.6 | 1 | red |
| Louisiana | 68.76 | 13.2 | 42.2 | 3545 | 2.8 | 1 | red |
| Maine | 70.39 | 2.7 | 54.7 | 3694 | 0.7 | 0 | blue |
| Maryland | 70.22 | 8.5 | 52.3 | 5299 | 0.9 | 0 | blue |
| Massachusetts | 71.83 | 3.3 | 58.5 | 4755 | 1.1 | 0 | blue |
| Michigan | 70.63 | 11.1 | 52.8 | 4751 | 0.9 | 0 | blue |
| Minnesota | 72.96 | 2.3 | 57.6 | 4675 | 0.6 | 0 | blue |
| Mississippi | 68.09 | 12.5 | 41 | 3098 | 2.4 | 1 | red |
| Missouri | 70.69 | 9.3 | 48.8 | 4254 | 0.8 | 1 | red |
| Montana | 70.56 | 5 | 59.2 | 4347 | 0.6 | 1 | red |
| Nebraska | 72.6 | 2.9 | 59.3 | 4508 | 0.6 | 1 | red |
| Nevada | 69.03 | 11.5 | 65.2 | 5149 | 0.5 | 0 | blue |
| NewHampshire | 71.23 | 3.3 | 57.6 | 4281 | 0.7 | 0 | blue |
| NewJersey | 70.93 | 5.2 | 52.5 | 5237 | 1.1 | 0 | blue |
| NewMexico | 70.32 | 9.7 | 55.2 | 3601 | 2.2 | 0 | blue |
| NewYork | 70.55 | 10.9 | 52.7 | 4903 | 1.4 | 0 | blue |
| NorthCarolina | 69.21 | 11.1 | 38.5 | 3875 | 1.8 | 1 | red |
| NorthDakota | 72.78 | 1.4 | 50.3 | 5087 | 0.8 | 1 | red |
| Ohio | 70.82 | 7.4 | 53.2 | 4561 | 0.8 | 0 | blue |
| Oklahoma | 71.42 | 6.4 | 51.6 | 3983 | 1.1 | 1 | red |
| Oregon | 72.13 | 4.2 | 60 | 4660 | 0.6 | 0 | blue |
| Pennsylvania | 70.43 | 6.1 | 50.2 | 4449 | 1 | 0 | blue |
| RhodeIsland | 71.9 | 2.4 | 46.4 | 4558 | 1.3 | 0 | blue |
| SouthCarolina | 67.96 | 11.6 | 37.8 | 3635 | 2.3 | 1 | red |
| SouthDakota | 72.08 | 1.7 | 53.3 | 4167 | 0.5 | 1 | red |
| Tennessee | 70.11 | 11 | 41.8 | 3821 | 1.7 | 1 | red |
| Texas | 70.9 | 12.2 | 47.4 | 4188 | 2.2 | 1 | red |
| Utah | 72.9 | 4.5 | 67.3 | 4022 | 0.6 | 1 | red |
| Vermont | 71.64 | 5.5 | 57.1 | 3907 | 0.6 | 0 | blue |
| Virginia | 70.08 | 9.5 | 47.8 | 4701 | 1.4 | 0 | blue |
| Washington | 71.72 | 4.3 | 63.5 | 4864 | 0.6 | 0 | blue |
| WestVirginia | 69.48 | 6.7 | 41.6 | 3617 | 1.4 | 1 | red |
| Wisconsin | 72.48 | 3 | 54.5 | 4468 | 0.7 | 0 | blue |
| Wyoming | 70.29 | 6.9 | 62.9 | 4566 | 0.6 | 1 | red |

Step by step
Solved in 2 steps with 1 images


