Below are bivariate data giving birthrate and life expectancy information for each of twelve countries. For each of the countries, both the number of births x one thousand people in the population and the female life expectancy y (in years) are given. These data are displayed in the Figure 1 scatter plot. Birthrate, x (number of births per 1000 pop.) 16.5 35.3 39.8 Female life expectancy, y (in years) 76.0 66.6 65.7 tanicy
Below are bivariate data giving birthrate and life expectancy information for each of twelve countries. For each of the countries, both the number of births x one thousand people in the population and the female life expectancy y (in years) are given. These data are displayed in the Figure 1 scatter plot. Birthrate, x (number of births per 1000 pop.) 16.5 35.3 39.8 Female life expectancy, y (in years) 76.0 66.6 65.7 tanicy

Glencoe Algebra 1, Student Edition, 9780079039897, 0079039898, 2018
18th Edition
ISBN:9780079039897
Author:Carter
Publisher:Carter
Chapter10: Statistics
Section10.4: Distributions Of Data
Problem 19PFA

Related questions
Question
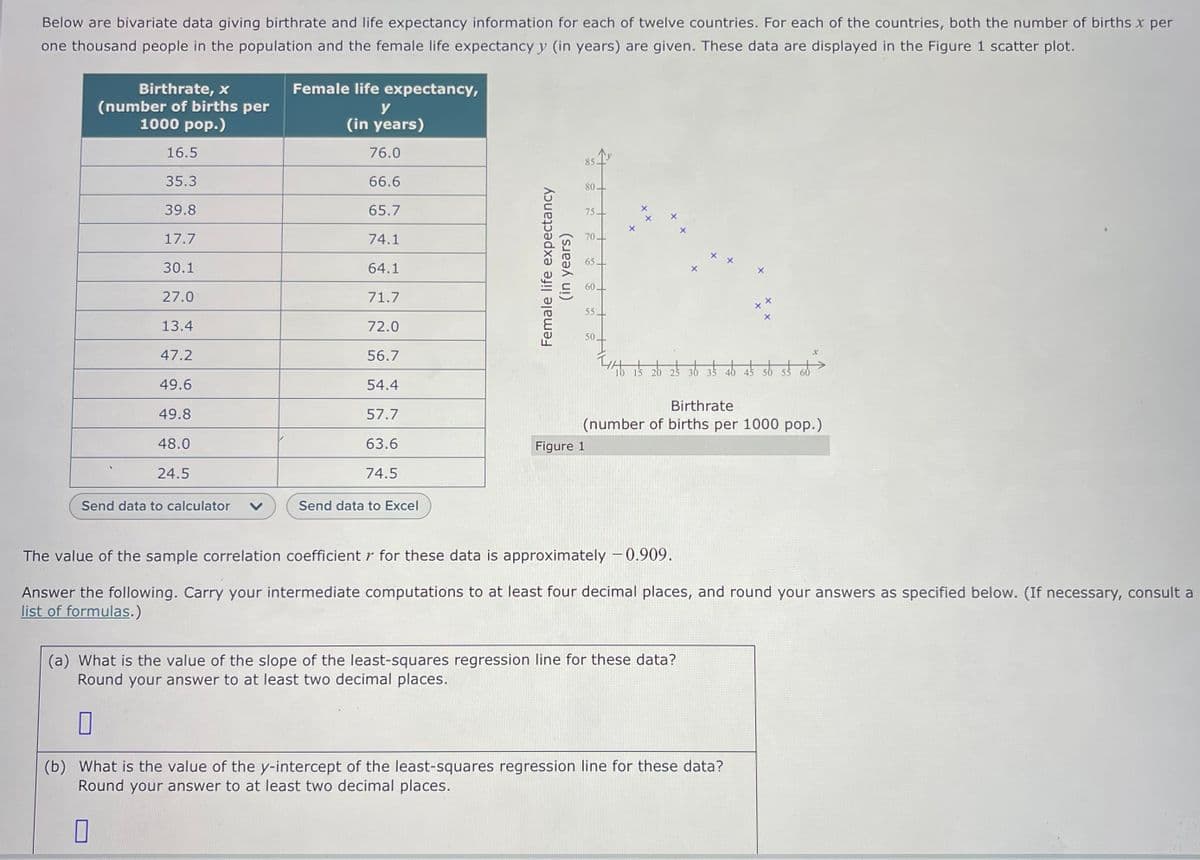
Transcribed Image Text:Below are bivariate data giving birthrate and life expectancy information for each of twelve countries. For each of the countries, both the number of births x per
one thousand people in the population and the female life expectancy y (in years) are given. These data are displayed in the Figure 1 scatter plot.
Birthrate, x
(number of births per
1000 pop.)
16.5
35.3
39.8
17.7
30.1
27.0
13.4
47.2
49.6
49.8
48.0
24.5
Send data to calculator
Female life expectancy,
y
(in years)
76.0
66.6
65.7
74.1
64.1
71.7
72.0
56.7
54.4
57.7
63.6
74.5
Send data to Excel
Female life expectancy
(in years)
85.
Figure 1
80-
75-
70.
65.
60
55
50
15 20 25 30 35 40 45 50 55
Birthrate
(number of births per 1000 pop.)
The value of the sample correlation coefficient r for these data is approximately - 0.909.
Answer the following. Carry your intermediate computations to at least four decimal places, and round your answers as specified below. (If necessary, consult a
list of formulas.)
(a) What is the value of the slope of the least-squares regression line for these data?
Round your answer to at least two decimal places.
(b) What is the value of the y-intercept of the least-squares regression line for these data?
Round your answer to at least two decimal places.
Expert Solution
This question has been solved!
Explore an expertly crafted, step-by-step solution for a thorough understanding of key concepts.

This is a popular solution!

Trending now
This is a popular solution!

Step by step
Solved in 3 steps

Recommended textbooks for you
Glencoe Algebra 1, Student Edition, 9780079039897…
Algebra
ISBN:
9780079039897
Author:
Carter
Publisher:
McGraw Hill
Glencoe Algebra 1, Student Edition, 9780079039897…
Algebra
ISBN:
9780079039897
Author:
Carter
Publisher:
McGraw Hill