
MATLAB: An Introduction with Applications
6th Edition
ISBN: 9781119256830
Author: Amos Gilat
Publisher: John Wiley & Sons Inc
expand_more
expand_more
format_list_bulleted
Related questions
Question
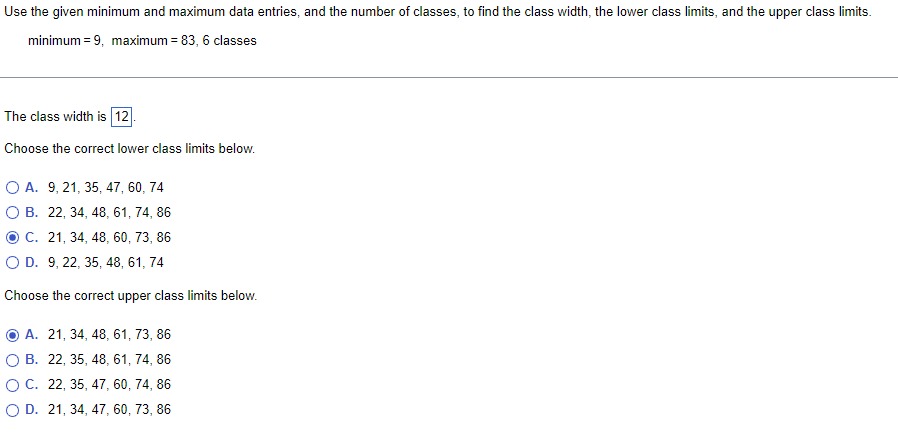

Transcribed Image Text:Use the given minimum and maximum data entries, and the number of classes, to find the class width, the lower class limits, and the upper class limits.
minimum = 9, maximum = 83, 6 classes
The class width is 12.
Choose the correct lower class limits below.
O A. 9, 21, 35, 47, 60, 74
O B. 22, 34, 48, 61, 74, 86
O C. 21, 34, 48, 60, 73, 86
O D. 9, 22, 35, 48, 61, 74
Choose the correct upper class limits below.
A. 21, 34, 48, 61, 73, 86
O B. 22, 35, 48, 61, 74, 86
O C. 22, 35, 47, 60, 74, 86
O D. 21, 34, 47, 60, 73, 86
Expert Solution
This question has been solved!
Explore an expertly crafted, step-by-step solution for a thorough understanding of key concepts.

This is a popular solution

Trending nowThis is a popular solution!

Step by stepSolved in 2 steps

Knowledge Booster

Similar questions
- draw 3 boxes for box and whisker plot ifor each of the data sets 1. 72, 74, 76, 78.80,82,84,86,88 2. 72,74,76,78,80,82,84,86,88 3. 72,74,76,78,80,82,84,86,88arrow_forwardA researcher collected information about the height of different flowers. What type of data is heightarrow_forward5. Complete the columns below using an initial class boundary of 53.5 and a class width of 4. Each non-work column should have ONLY final values, NOT work or set-up. There are optional columns for work or set-up, which may be left blank. Answer the relative frequency as whole number percentages. 72, 60, 66, 72, 54, 73, 55, 58, 70, 70, 56, 69, 60 Seconds (Class Boundary) (optional) Work Frequency (optional) Work Relative Frequency Cumulative Frequencyarrow_forward
- How will I draw this bar chart using R code? X axis will be month, y axis will be the amount of immigrants. Thanks.arrow_forwardcompute the range for the set of data 13, 13, 13, 20, 24, 24, 24arrow_forwardHere are the scores of 13 students on a geography test. 59, 60, 61, 61, 67, 71, 73, 74, 85, 85, 86, 88, 89 Notice that the scores are ordered from least to greatest. Give the five-number summary and the interquartile range for the data set. Five-number summary Minimum: Lower quartile: Median: Upper quartile: Maximum: Interquartile range: 0arrow_forward
- 26, 45, 27, 50, 40, 52,12, 28, 48, 52,14, 20,32, 9, 36,10, 36, 51, 42, 1, 30, 21, 40, 37, 13, 35, 57, 47, 42, 53 Create a histogram to display the data.arrow_forwarddetermine the range 12,20 ,22,13,13,28,22,19,13,17arrow_forwardCreate a relative frequency table for the numbers 2, 2, 2, 3, 3arrow_forward
- Select whether the value of each statistic for the distances of the stars from Earth increases, decreases, or stays the same when the data point is removed.arrow_forwardThe frequencies of traffic fatalities of nonoccupants of vehicles are shown in the following bar chart. Change this to a bar chart of relative frequencies.arrow_forward5.arrow_forward
arrow_back_ios
SEE MORE QUESTIONS
arrow_forward_ios
Recommended textbooks for you
- MATLAB: An Introduction with ApplicationsStatisticsISBN:9781119256830Author:Amos GilatPublisher:John Wiley & Sons Inc
 Probability and Statistics for Engineering and th...StatisticsISBN:9781305251809Author:Jay L. DevorePublisher:Cengage Learning
 Statistics for The Behavioral Sciences (MindTap C...StatisticsISBN:9781305504912Author:Frederick J Gravetter, Larry B. WallnauPublisher:Cengage Learning
  Elementary Statistics: Picturing the World (7th E...StatisticsISBN:9780134683416Author:Ron Larson, Betsy FarberPublisher:PEARSON
 The Basic Practice of StatisticsStatisticsISBN:9781319042578Author:David S. Moore, William I. Notz, Michael A. FlignerPublisher:W. H. Freeman
 Introduction to the Practice of StatisticsStatisticsISBN:9781319013387Author:David S. Moore, George P. McCabe, Bruce A. CraigPublisher:W. H. Freeman
MATLAB: An Introduction with Applications
Statistics
ISBN:9781119256830
Author:Amos Gilat
Publisher:John Wiley & Sons Inc
Probability and Statistics for Engineering and th...
Statistics
ISBN:9781305251809
Author:Jay L. Devore
Publisher:Cengage Learning
Statistics for The Behavioral Sciences (MindTap C...
Statistics
ISBN:9781305504912
Author:Frederick J Gravetter, Larry B. Wallnau
Publisher:Cengage Learning
Elementary Statistics: Picturing the World (7th E...
Statistics
ISBN:9780134683416
Author:Ron Larson, Betsy Farber
Publisher:PEARSON
The Basic Practice of Statistics
Statistics
ISBN:9781319042578
Author:David S. Moore, William I. Notz, Michael A. Fligner
Publisher:W. H. Freeman
Introduction to the Practice of Statistics
Statistics
ISBN:9781319013387
Author:David S. Moore, George P. McCabe, Bruce A. Craig
Publisher:W. H. Freeman