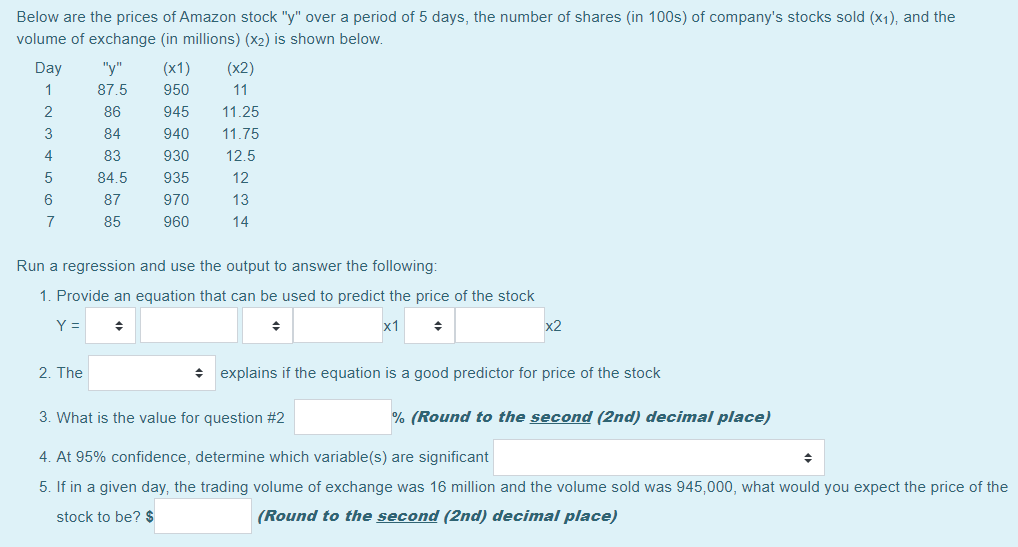
Below are the prices of Amazon stock "y" over a period of 5 days, the number of shares (in 100s) of company's stocks sold (x1), and the volume of exchange (in millions) (x2) is shown below. Day "y" (x1) (x2) 1 87.5 950 11 86 945 11.25 3 84 940 11.75 4 83 930 12.5 84.5 935 12 6 87 970 13 7 85 960 14 Run a regression and use the output to answer the following: 1. Provide an equation that can be used to predict the price of the stock Y = x1 x2 2. The + explains if the equation is a good predictor for price of the stock 3. What is the value for question #2 % (Round to the second (2nd) decimal place)


Correlation
Correlation defines a relationship between two independent variables. It tells the degree to which variables move in relation to each other. When two sets of data are related to each other, there is a correlation between them.
Linear Correlation
A correlation is used to determine the relationships between numerical and categorical variables. In other words, it is an indicator of how things are connected to one another. The correlation analysis is the study of how variables are related.
Regression Analysis
Regression analysis is a statistical method in which it estimates the relationship between a dependent variable and one or more independent variable. In simple terms dependent variable is called as outcome variable and independent variable is called as predictors. Regression analysis is one of the methods to find the trends in data. The independent variable used in Regression analysis is named Predictor variable. It offers data of an associated dependent variable regarding a particular outcome.

Step by step
Solved in 3 steps


