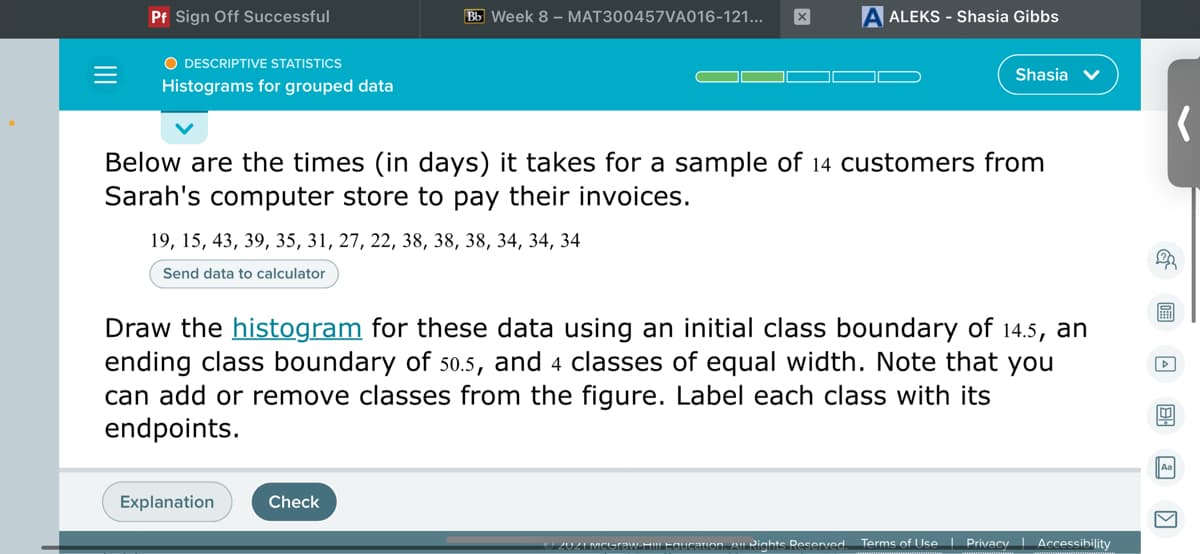
Below are the times (in days) it takes for a sample of 14 customers from Sarah's computer store to pay their invoices. 19, 15, 43, 39, 35, 31, 27, 22, 38, 38, 38, 34, 34, 34 Send data to calculator Draw the histogram for these data using an initial class boundary of 14.5, an ending class boundary of 50.5, and 4 classes of equal width. Note that you can add or remove classes from the figure. Label each class with its endpoints.
Below are the times (in days) it takes for a sample of 14 customers from Sarah's computer store to pay their invoices. 19, 15, 43, 39, 35, 31, 27, 22, 38, 38, 38, 34, 34, 34 Send data to calculator Draw the histogram for these data using an initial class boundary of 14.5, an ending class boundary of 50.5, and 4 classes of equal width. Note that you can add or remove classes from the figure. Label each class with its endpoints.

Glencoe Algebra 1, Student Edition, 9780079039897, 0079039898, 2018
18th Edition
ISBN:9780079039897
Author:Carter
Publisher:Carter
Chapter10: Statistics
Section: Chapter Questions
Problem 13PT

Related questions
Question
Transcribed Image Text:O DESCRIPTIVE STATISTICS
Shasia v
Histograms for grouped data
Tan
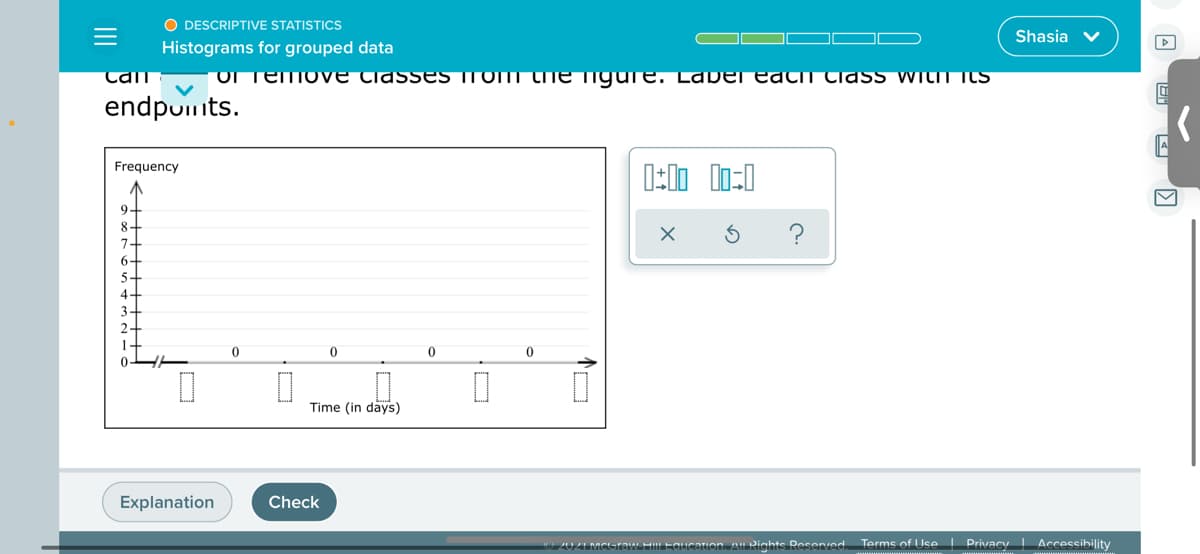
OTemo ve CiassES Trom the igure. Laber eath tlass withI ItS
endpumts.
Frequency
9.
8
7.
6-
5
Time (in days)
Explanation
Check
2021 MCGraw HiL Equcarion. Al Rights Reserved.
Terme of Use I Privacy | Accessibility
Transcribed Image Text:Pf Sign Off Successful
Bb Week 8 – MAT300457VA016-121...
A ALEKS - Shasia Gibbs
O DESCRIPTIVE STATISTICS
Shasia v
Histograms for grouped data
Below are the times (in days) it takes for a sample of 14 customers from
Sarah's computer store to pay their invoices.
19, 15, 43, 39, 35, 31, 27, 22, 38, 38, 38, 34, 34, 34
Send data to calculator
Draw the histogram for these data using an initial class boundary of 14.5, an
ending class boundary of 50.5, and 4 classes of equal width. Note that you
can add or remove classes from the figure. Label each class with its
endpoints.
Aa
Explanation
Check
2UZI MCGraw HI Equcaion. A Rights Reserved.
Terms of Use Privacy | Accessibility
Expert Solution
Step 1
Given,
| Days |
| 19 |
| 15 |
| 43 |
| 39 |
| 35 |
| 31 |
| 27 |
| 22 |
| 38 |
| 38 |
| 34 |
| 34 |
| 34 |

Trending now
This is a popular solution!

Step by step
Solved in 2 steps with 1 images

Knowledge Booster


Learn more about
Need a deep-dive on the concept behind this application? Look no further. Learn more about this topic, statistics and related others by exploring similar questions and additional content below.Recommended textbooks for you
Glencoe Algebra 1, Student Edition, 9780079039897…
Algebra
ISBN:
9780079039897
Author:
Carter
Publisher:
McGraw Hill

College Algebra (MindTap Course List)
Algebra
ISBN:
9781305652231
Author:
R. David Gustafson, Jeff Hughes
Publisher:
Cengage Learning
Glencoe Algebra 1, Student Edition, 9780079039897…
Algebra
ISBN:
9780079039897
Author:
Carter
Publisher:
McGraw Hill
College Algebra (MindTap Course List)
Algebra
ISBN:
9781305652231
Author:
R. David Gustafson, Jeff Hughes
Publisher:
Cengage Learning