Below is a 5-figure summary of some data. n=66 105 100 117 144 174 Select the option which gives the interquartile range for these data. Select one: ○ 30 ○ 27 ○ 12 ○ 39 ○ 74 ○ 5
Below is a 5-figure summary of some data. n=66 105 100 117 144 174 Select the option which gives the interquartile range for these data. Select one: ○ 30 ○ 27 ○ 12 ○ 39 ○ 74 ○ 5

Glencoe Algebra 1, Student Edition, 9780079039897, 0079039898, 2018
18th Edition
ISBN:9780079039897
Author:Carter
Publisher:Carter
Chapter10: Statistics
Section10.5: Comparing Sets Of Data
Problem 14PPS

Related questions
Question
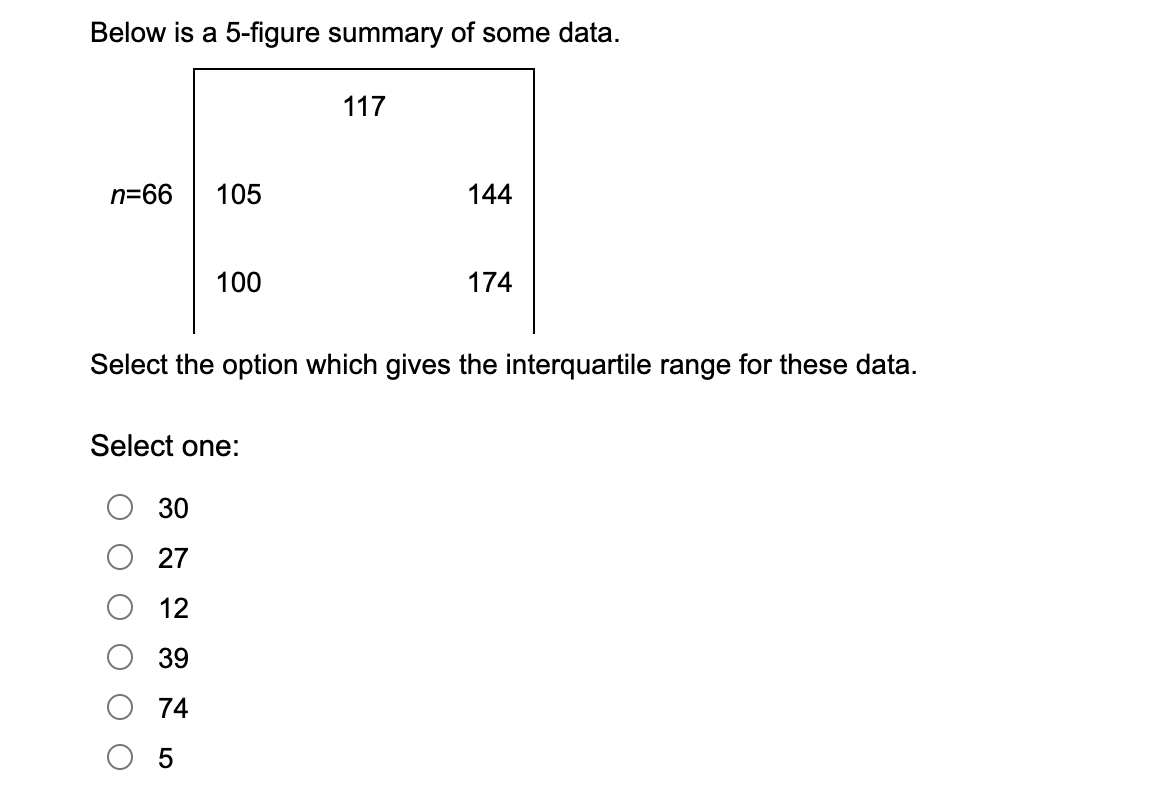
Transcribed Image Text:Below is a 5-figure summary of some data.
n=66
105
100
117
144
174
Select the option which gives the interquartile range for these data.
Select one:
O
30
27
12
39
74
LO
5
Expert Solution
This question has been solved!
Explore an expertly crafted, step-by-step solution for a thorough understanding of key concepts.

Step by step
Solved in 3 steps with 2 images

Recommended textbooks for you
Glencoe Algebra 1, Student Edition, 9780079039897…
Algebra
ISBN:
9780079039897
Author:
Carter
Publisher:
McGraw Hill

Mathematics For Machine Technology
Advanced Math
ISBN:
9781337798310
Author:
Peterson, John.
Publisher:
Cengage Learning,
Glencoe Algebra 1, Student Edition, 9780079039897…
Algebra
ISBN:
9780079039897
Author:
Carter
Publisher:
McGraw Hill
Mathematics For Machine Technology
Advanced Math
ISBN:
9781337798310
Author:
Peterson, John.
Publisher:
Cengage Learning,