Below is some of the regression output from a simple regression of the number of wins for a major league baseball team and the size amount of money the team is paying its players (expressed in millions of $'s) *please fill in the
Below is some of the regression output from a simple regression of the number of wins for a major league baseball team and the size amount of money the team is paying its players (expressed in millions of $'s) *please fill in the

Linear Algebra: A Modern Introduction
4th Edition
ISBN:9781285463247
Author:David Poole
Publisher:David Poole
Chapter4: Eigenvalues And Eigenvectors
Section4.6: Applications And The Perron-frobenius Theorem
Problem 25EQ

Related questions
Question
20) Below is some of the regression output from a simple regression of the number of wins for a major league baseball team and the size amount of money the team is paying its players (expressed in millions of $'s)
*please fill in the blanks of the table*
(show the scratch work so that I can understand)
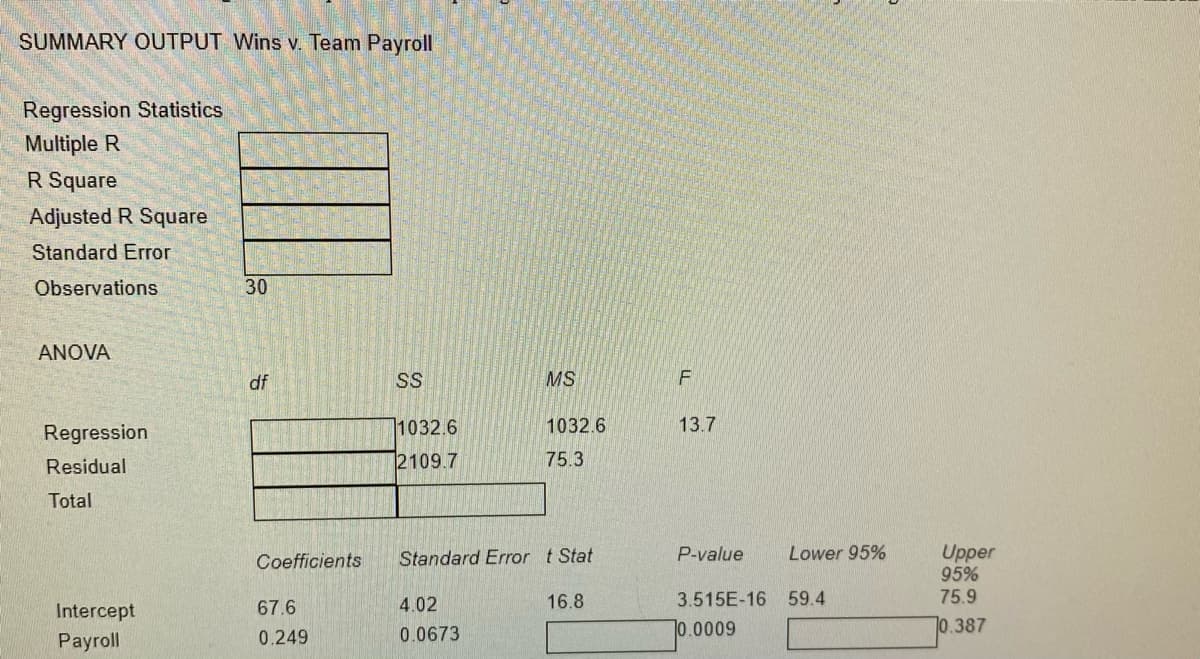
Transcribed Image Text:SUMMARY OUTPUT Wins v. Team Payroll
Regression Statistics
Multiple R
R Square
Adjusted R Square
Standard Error
Observations
30
ANOVA
df
SS
MS
Regression
1032.6
1032.6
13.7
Residual
12109.7
75.3
Total
Upper
95%
75.9
Coefficients
Standard Error t Stat
P-value
Lower 95%
67.6
4.02
16.8
3.515E-16 59.4
Intercept
0.0673
0.0009
0.387
Payroll
0.249
Expert Solution
This question has been solved!
Explore an expertly crafted, step-by-step solution for a thorough understanding of key concepts.

Step by step
Solved in 4 steps with 6 images

Recommended textbooks for you
Linear Algebra: A Modern Introduction
Algebra
ISBN:
9781285463247
Author:
David Poole
Publisher:
Cengage Learning

Big Ideas Math A Bridge To Success Algebra 1: Stu…
Algebra
ISBN:
9781680331141
Author:
HOUGHTON MIFFLIN HARCOURT
Publisher:
Houghton Mifflin Harcourt

Algebra & Trigonometry with Analytic Geometry
Algebra
ISBN:
9781133382119
Author:
Swokowski
Publisher:
Cengage
Linear Algebra: A Modern Introduction
Algebra
ISBN:
9781285463247
Author:
David Poole
Publisher:
Cengage Learning
Big Ideas Math A Bridge To Success Algebra 1: Stu…
Algebra
ISBN:
9781680331141
Author:
HOUGHTON MIFFLIN HARCOURT
Publisher:
Houghton Mifflin Harcourt
Algebra & Trigonometry with Analytic Geometry
Algebra
ISBN:
9781133382119
Author:
Swokowski
Publisher:
Cengage