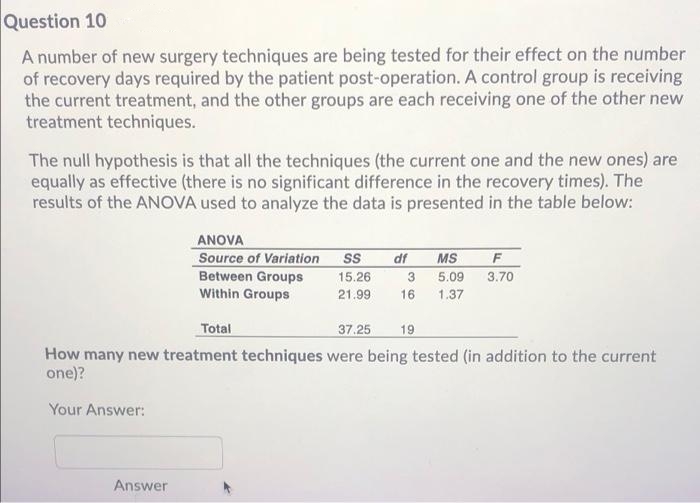
A number of new surgery techniques are being tested for their effect on the number of recovery days required by the patient post-operation. A control group is receiving the current treatment, and the other groups are each receiving one of the other new treatment techniques.
Q: A relay microchip in a telecommunications satellite has a life expectancy that follows a normal dist...
A:
Q: 1) Estimate standard enror of the mean 2) Find 95%. confidence intorval for the population mean. TWO...
A:
Q: Assume that a sample is used to estimate a population proportion p. Find the 98% confidence interval...
A: Given that n=350 , X=161 Formula for confidence interval C.I = (p ± √(p(1 - p)/n))
Q: You measure 26 randomly selected textbooks' weights, and find they have a mean weight of 69 ounces. ...
A: Given that x̄ = 69 , ? = 13.4 , n =26
Q: TInterval Refer to the accompanying data display that results from a simple random sample of times (...
A: Given result ,
Q: a. What is the distribution of U = Y?? Explain using the concepts discussed in class. b. What is the...
A:
Q: Suppose the elements of 2 are the positive integers and define the probability set function P(@) = k...
A:
Q: Given is the population of residents in a community grouped according to their blood type. Complete ...
A:
Q: 2. A district supervisor of a certain school surveyed 28 randomly selected teachers and found that t...
A: For the given problem determine the appropriate test statistics
Q: Fror de retail price index number as well. Particulars relating to food items : compute the index nu...
A:
Q: The table below shows the color and the model of cars purchased by 160 randomly selected customers a...
A: Given The table below shows the color and the model of cars purchased by 160 randomlyselected custom...
Q: 1. How many random samples of size 3 can be made? [ Select ] 2. What are the possible sample means f...
A: Here sample is drawn without replacement
Q: Below is some of the regression output from a simple regression of the number of wins for a major le...
A: The independent variable is Payroll. The dependent variable is Wins. We have to fill the missing val...
Q: You are conducting a test of homogeneity for the claim that two different populations have the same ...
A: Given Population #1 Population #2 Total A 43 119 162 B 22 28 50 Total 65 147 212
Q: The follewing tae shows the mahemas aliny wd abat reasening aaay ef 10 stadents Student Mathwmatics ...
A:
Q: Suppose that in a multinomial distribution, the probability of five successes out of ten trials is 0...
A:
Q: Was there a majority winner in this election, and if so, who was it? a. Ruth Dwyer b. Hardy Macia c....
A: We have given that the total number of votes are 303209. The majority votes for the winner are = 3...
Q: The data set below on the left represents the annual rate of return (in percent) of eight randomly s...
A:
Q: For the following population, calculate the mean, median, mode, variance, standard deviation, coeffi...
A: Use EXCEL Procedure for finding the given values. Follow the instruction to obtain the values: ...
Q: Discuss when should you use T-test, one-way anova, and pearsons r as a statistical tool in a researc...
A: T Test It is one of the most popular statistical techniques used to test whether mean difference bet...
Q: The following sample data represent the number of late and on time flights for the Delta, United and...
A:
Q: se the sample data below to test the hypotheses Ho: Pi = P2 = P3 H : Not all population proportions ...
A: Given : Hypothesis: H0: p1=p2=p3Ha: Not all population proportions are the same
Q: of hypotnesis has Type I error probability we mean A. If the null hypothesis is true, we do not reje...
A: *Answer:
Q: Mini Task Instructions: Find the probability given the following conditions. Create a table like the...
A:
Q: Express the confidence interval (0.021,0.109) in the form of p- E<p<p+E. |<p< (Type integers or deci...
A: Solution-: Given C.I. is (0.021,0.109) We write it in the form of p^-E<p<p^+E
Q: The amount of money spent weekly on cleaning, maintenance, and repairs at a large restaurant was obs...
A:
Q: Match the histograms on the right to the summary statistics given. Standard Mean Median Deviation 53...
A: Match the given graphs with mean ,median and s.d
Q: Suppose we select a number at random from the set {1, 2, ..., 314, 315}. Find the probability that t...
A:
Q: 9.1 Local community leaders are concemed about the distribution of homicides in their small town. Th...
A: The given data is: In order to infer the claim if the distribution of homicide is truly independent...
Q: Based on the regression output, if you wanted to test whether the number of wins is related to the t...
A: Test is that whether the number of wins is related to the team payroll. It is given that P-value for...
Q: From the data given below find the cost of living index number for 1998. Per cent of total Items Pri...
A:
Q: defective. In a random sample of 120 items, the defect rate is 4.99%. At the 1% leve significance, t...
A: According to the given information in this question we need to find the critical values Based on the...
Q: People tend to evaluate the quality of their lives to others around them. In a demonstration of this...
A: Given that, the scores are measures of a life-satisfaction scale for a sample of n=9 elderly people ...
Q: For the following distribution table, the proportion of data greater than or equal 3.2 and less than...
A: Answer are given below
Q: Terri Vogel, an amateur motorcycle racer, averages 129.71 seconds per 2.5 mile lap (in a seven-lap r...
A: Given that Mean=129.71 Standard deviation=2.28 Note: According to bartleby experts question answers...
Q: The waiting times between a subway departure schedule and the arrival of a passenger are uniformly d...
A:
Q: Show that for every decreasing sequence of events, {E,,n2 1}, lim P(E,)= P(lim E,)
A: Here, for every decreasing sequence of events We have to prove, En, n≥1, limn→∞PEn=Plimn→∞En
Q: The Peabody Vocabulary Test have a standard score population mean of 100 and standard deviation ...
A: For the given data Perform z test for one mean
Q: When testing this hypothesis, what is the test statistic
A: Test is that whether the payroll coefficient is at least 0.20.
Q: A normal distribution has a population mean of u=75 and a standard deviation of o=9. What is the P(X...
A:
Q: Use the data set for number of pets. A. Construct and graph the discrete probability distribution fr...
A: Discrete Probability Distribution: Discrete probability distribution is a list of each potential va...
Q: The increasing annual cost (including tuition, room, board, books, and fees) to attend college has b...
A: We know that, Mean= ΣXi/n And standard deviation, s=√(Xi-mean)2/(n-1) Let X1 represents private coll...
Q: 12. An independent-measures study uses n = 15 participants in each group to compare two treatment co...
A:
Q: You work as a manager in the admission department of company. You were asked by your department head...
A: Frequency is the count of the individual observation. It can be tabulated as discrete frequency dist...
Q: Fill in the blanks. (Enter an exact positive number as an integer, fraction, or decimal.) In a norma...
A: Here use basic of normal distribution
Q: (wolio! Jlgw) For the following frequency table, if the arithmetic mean equals 9, then the constant ...
A: We have given that the grouped frequency table. The arithmetic mean is equals to 9.
Q: Measuring success as the ratio of runs/at-bats makes sense. Suppose the mean ratio for the league is...
A: Given that X~N(μ= 0.200 , σ= 0.01 ) μ= 0.200 , σ= 0.01 At X=0.220 Find Z-score
Q: given data set to answer parts (a) and (b) a. Find the regression equation for the data points b. Gr...
A: We have given that, X :- 1, 4, 3 Y:- -1, 0, -3 Then, We will find the regression equation?
Q: 5) Suppose x is normally distributed with mean 100, and P(x < 90) = 0.4. What is P(90 < x < 110)? a)...
A:
Q: Do the histogram
A: Histogram is the graph used to visualize the categorical data. It is used to understand the spread a...
1.
Step by step
Solved in 2 steps
- QUESTION 12 Historically, the proportion of people who trade in their old car to a car dealer when purchasing a new car is 48%. Over the previous 6 months, in a sample of 115 new-car buyers, 46 have traded in their old car. To determine (at the 10% level of significance) whether the proportion of new-car buyers that trade in their old car has statistically significantly decreased, what can you conclude concerning the null hypothesis?QUESTION 12 Historically, the proportion of people who trade in their old car to a car dealer when purchasing a new car is 48%. Over the previous 6 months, in a sample of 115 new-car buyers, 46 have traded in their old car. To determine (at the 10% level of significance) whether the proportion of new-car buyers that trade in their old car has statistically significantly decreased, what can you conclude concerning the null hypothesis? Reject the null hypothesis Fail to reject the null hypothesisQuestion 9 A well-known brokerage firm executive claimed that 60% of investors are currently confident of meeting their investment goals. An XYZ Investor Optimism Survey, conducted over a two week period, found that in a sample of 100 people, 61% of them said they are confident of meeting their goals.Test the claim that the proportion of people who are confident is larger than 60% at the 0.10 significance level.The null and alternative hypothesis would be: H0:μ≤0.6H0:μ≤0.6H1:μ>0.6H1:μ>0.6 H0:p≥0.6H0:p≥0.6H1:p<0.6H1:p<0.6 H0:p≤0.6H0:p≤0.6H1:p>0.6H1:p>0.6 H0:μ≥0.6H0:μ≥0.6H1:μ<0.6H1:μ<0.6 H0:μ=0.6H0:μ=0.6H1:μ≠0.6H1:μ≠0.6 H0:p=0.6H0:p=0.6H1:p≠0.6H1:p≠0.6 The test is: left-tailed right-tailed two-tailed The test statistic is: (to 2 decimals)The p-value is: (to 4 decimals)Based on this we: Fail to reject the null hypothesis Reject the null hypothesis
- Question 17: A well-known brokerage firm executive claimed that 90% of investors are currently confident of meeting their investment goals. An XYZ Investor Optimism Survey, conducted over a two week period, found that in a sample of 100 people, 81% of them said they are confident of meeting their goals.Test the claim that the proportion of people who are confident is smaller than 90% at the 0.05 significance level.The null and alternative hypothesis would be: H0:p≤0.9H0:p≤0.9H1:p>0.9H1:p>0.9 H0:μ≤0.9H0:μ≤0.9H1:μ>0.9H1:μ>0.9 H0:μ≥0.9H0:μ≥0.9H1:μ<0.9H1:μ<0.9 H0:μ=0.9H0:μ=0.9H1:μ≠0.9H1:μ≠0.9 H0:p=0.9H0:p=0.9H1:p≠0.9H1:p≠0.9 H0:p≥0.9H0:p≥0.9H1:p<0.9H1:p<0.9 The test is: two-tailed right-tailed left-tailed The test statistic is: (to 3 decimals)The p-value is: (to 4 decimals)Based on this we: Fail to reject the null hypothesis Reject the null hypothesisQuestion #4. US Universities found that 72% of people are concerned about the possibility that their personal records could be stolen over the Internet. If a random sample of 300 college students at a Midwestern university were taken and 228 of them were concerned about the possibility that their personal records could be stolen over the Internet, could you conclude at the 0.025 level of significance that a higher proportion of the university's college students are concerned about Internet theft than the public at large? Report the p-value for this test. Z0.025 = 1.96QUESTION 19 To study whether the students at a university are more or less satisfied with the current food service compared to the previous food service, a sample of 90 current students is taken and finds that 37 are satisfied with the current food service. A similar survey was taken for the previous food service in which 89 students surveyed found that 40 were satisfied with the previous food service. When testing the hypothesis (at the 5% level of significance) a higher percentage of students were satisfied with the previous food service than with the current food service, what is the test statistic? (please round your answer to 2 decimal places)
- Question 1) Consider the following context: The nutrition and food science division of Farnsworth Pharmaceuticals is alpha testing an OTC diagnostic kit so that adults who self-report a certain food allergy can affirm their insensitivity to that food allergen. Preliminary clinical trials yielded that 25% of the volunteers who suspected they had food allergies were clinically identified as sensitive or intolerant to the food allergen; unfortunately and disappointingly, only 10% of those who tested positive in the clinic also tested positive with the kit. Furthermore, of those self-reporting adult volunteers who had a negative clinic outcome, 5% tested positive anyway with the kit. How many complete branches, from start to finish, would a tree diagram that models this context include? H Question 2) The nutrition and food science division of Farnsworth Pharmaceuticals is alpha testing an OTC diagnostic kit so that adults who self-report a certain food allergy can affirm their…Question 2 A researcher was interested in studying if there is a significant relationship between the severity of COVID 19 and blood types of individuals. 2400 individuals were studied and the results are shown below. Condition Blood Type O A B AB Total Critical 64 44 20 8 136 Severe 175 129 50 15 369 Moderate 211 528 151 125 1015 Mild 200 400 140 140 880 Total 650 1101 361 288 240 a .State both the null and alternative hypotheses. b. Provide the decision rule for making this decision. Use an alpha level of 5%. c. Show all of the work necessary to calculate the appropriate statistic.d. What conclusion are you allowed to draw? e. Would your conclusion change at the 10% level of significance?QUESTION 3 The Research Unit for Cecilion Supermart conducted an experiment to estimate the strength of thecarrier bag from the starch-based biofilms made from two different jicamas (sengkuang) of type Aand type B. However, the researcher claims that jicama type A produces more strength comparedto type B. To support this claim, 10kg weight item was put into 100 carrier bags made from jicamatype A and 200 carrier bags made from jicama type B were randomly selected. As a result, 8 bagsfrom jicama type A burst while 12 bags from jicama type B burst. Calculate a 95% confidenceinterval for the difference in true proportion of the carrier bags which burst between jicama type Aand type B. Give comment on the parameter estimate.
- question 4 Chen et al. (2000) examined the foraging behaviour of northern elephant seals (Mirounga angustirostris) that breed along the west coast of Mexico and the USA. They attached platform satellite transmitter terminals (PTTs) to 22 male seals and recorded, for each seal, the distance (km) to its main feeding area offshore and the amount of time (days) it spent at the feeding area. The results are presented below: What two null hypotheses are being tested with the output shown above? What statistical conclusions would you draw about these hypotheses? Complete the regression equation by filling in the blanks (to the nearest 3 decimal places). duration = + * distance What is one biological interpretation of this relationship between duration and distance ? What % of the variation in duration at main feeding area was explained by distance to feeding area?QUESTION 33 A clinical trial is run to investigate the effectiveness of an experimental drug in reducing preterm delivery to a drug considered standard care and to a placebo. Pregnant women are enrolled and randomly assigned to receive either the experimental drug, the standard drug or a placebo. Women are followed through delivery and classified as delivering preterm (< 37 weeks) or not. The data are shown below. Preterm Delivery Experimental Drug Standard Drug Placebo Yes 17 23 35 No 83 77 65 Is there a statistically significant difference in the proportions of women delivering preterm among the three treatment groups? Run the test at a 5% level of significance.Question 5 b) Twenty percent of individuals who seek psychotherapy will recover from their symptoms irrespective of whether they receive treatment. A research finds that a particular type of psychotherapy is successful with 30 out of 100 clients. Using an alpha level of 0.05 as a criterion, what should she conclude about the effectiveness of this psychotherapeutic approach?