Below is the Output from a Paired Samples comparing the number of vegetables students eat, versus the number of fruits they eat. The researcher who conducted the study believes students eat fewer fruits than vegetables. Using this output, answer the questions below A) Report the t-statistic (including the de
Below is the Output from a Paired Samples comparing the number of vegetables students eat, versus the number of fruits they eat. The researcher who conducted the study believes students eat fewer fruits than vegetables. Using this output, answer the questions below A) Report the t-statistic (including the de

Glencoe Algebra 1, Student Edition, 9780079039897, 0079039898, 2018
18th Edition
ISBN:9780079039897
Author:Carter
Publisher:Carter
Chapter10: Statistics
Section10.5: Comparing Sets Of Data
Problem 2GP

Related questions
Question
Below is the Output from a Paired Samples comparing the number of vegetables students eat, versus the number of fruits they eat. The researcher who conducted the study believes students eat fewer fruits than vegetables. Using this output, answer the questions below
A) Report the t-statistic (including the degrees of freedom) and p-value for this analysis.
B) Given an alpha = .05, should the researcher reject or retain the null hypothesis? Explain your reasoning.
C) In everyday language, what do these results tell you about the research question? Hint: What can be concluded about the number of fruits and vegetables students eat?
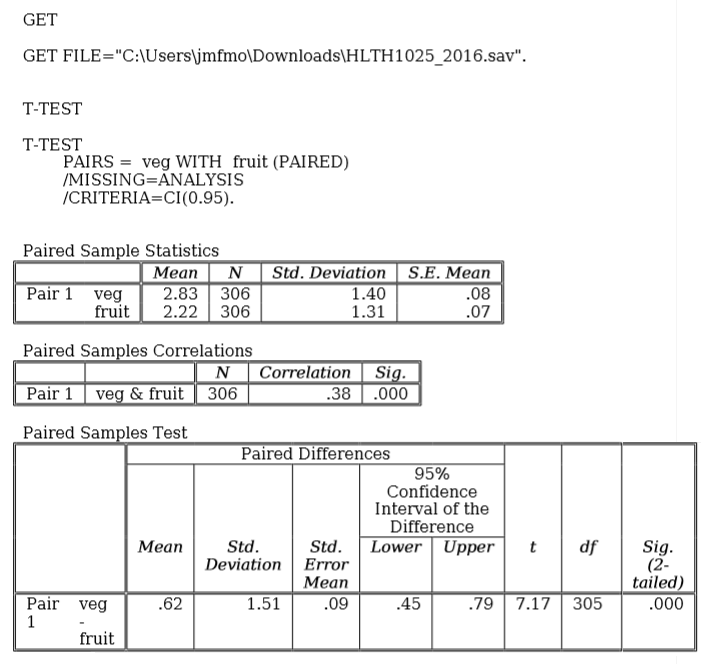
Transcribed Image Text:GET
GET FILE="C:\Users\jmfmo\Downloads\HLTH1025_2016.sav".
T-TEST
T-TEST
PAIRS = veg WITH fruit (PAIRED)
/MISSING ANALYSIS
/CRITERIA=CI(0.95).
N Std. Deviation S.E. Mean
1.40
.08
1.31
.07
Correlation | Sig.
.38.000
Paired Differences
Std.
Error
Mean
.09
Paired Sample Statistics
Mean
Pair 1 veg
2.83 306
fruit
2.22 306
Paired Samples Correlations
N
Pair 1 veg & fruit | 306
Paired Samples Test
Mean
.62
Pair veg
1
fruit
Std.
Deviation
1.51
95%
Confidence
Interval of the
Difference
Lower Upper
.45
t
df
.79 7.17 305
Sig.
(2-
tailed)
.000
Expert Solution
This question has been solved!
Explore an expertly crafted, step-by-step solution for a thorough understanding of key concepts.

Step by step
Solved in 3 steps

Recommended textbooks for you
Glencoe Algebra 1, Student Edition, 9780079039897…
Algebra
ISBN:
9780079039897
Author:
Carter
Publisher:
McGraw Hill
Glencoe Algebra 1, Student Edition, 9780079039897…
Algebra
ISBN:
9780079039897
Author:
Carter
Publisher:
McGraw Hill