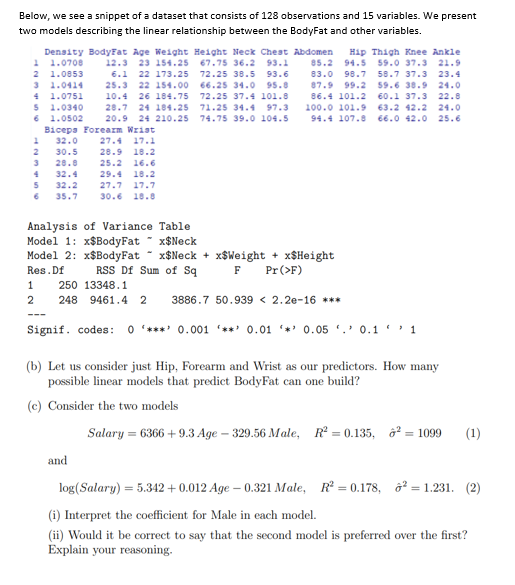
Below, we see a snippet of a dataset that consists of 128 observations and 15 variables. We present two models describing the linear relationship between the BodyFat and other variables. 58.7 37.3 23.4 59.6 38.9 24.0 Density BodyFat Age Weight Height Neck Chest Abdomen Hip Thigh Knee Ankle 11.0708 12.3 23 154.25 67.75 36.2 93.1 85.2 94.5 59.0 37.3 21.9 2 1.0853 6.1 22 173.25 72.25 38.5 93.6 83.0 98.7 3 1.0414 25.3 22 154.00 66.25 34.0 95.8 87.9 99.2 4 1.0751 10.4 26 184.75 72.25 37.4 101.8 86.4 101.2 5 1.0340 28.7 24 184.25 71.25 34.4 97.3 100.0 101.9 61.0502 20.9 24 210.25 74.75 39.0 104.5 94.4 107.8 Biceps Forearm Wrist 60.1 37.3 22.8 63.2 42.2 24.0 66.0 42.0 25.6 32.0 27.4 17.1 2 30.5 28.9 18.2 3 20.0 25.2 16.6 29.1 18.2 432.4 5 32.2 27.7 27.7 35.7 30.6 10.8 Analysis of Variance Table Model 1: x$BodyFat - x$Neck Model 2: x$BodyFat x$Neck+xSWeight + x$Height F Pr(>F) Res.Df RSS Df Sum of Sq 1 250 13348.1 2 248 9461.4 2 3886.7 50.939 <2.2e-16 *** Signif. codes: 00.001 0.01 0.05 0.11 (b) Let us consider just Hip, Forearm and Wrist as our predictors. How many possible linear models that predict BodyFat can one build? (e) Consider the two models Salary = 6366 +9.3 Age - 329.56 Male, R² = 0.135, ²= 1099 (1) and log(Salary) = 5.342 +0.012 Age - 0.321 Male, R² = 0.178, 8²=1.231. (2) (i) Interpret the coefficient for Male in each model. (ii) Would it be correct to say that the second model is preferred over the first? Explain your reasoning.
Below, we see a snippet of a dataset that consists of 128 observations and 15 variables. We present two models describing the linear relationship between the BodyFat and other variables. 58.7 37.3 23.4 59.6 38.9 24.0 Density BodyFat Age Weight Height Neck Chest Abdomen Hip Thigh Knee Ankle 11.0708 12.3 23 154.25 67.75 36.2 93.1 85.2 94.5 59.0 37.3 21.9 2 1.0853 6.1 22 173.25 72.25 38.5 93.6 83.0 98.7 3 1.0414 25.3 22 154.00 66.25 34.0 95.8 87.9 99.2 4 1.0751 10.4 26 184.75 72.25 37.4 101.8 86.4 101.2 5 1.0340 28.7 24 184.25 71.25 34.4 97.3 100.0 101.9 61.0502 20.9 24 210.25 74.75 39.0 104.5 94.4 107.8 Biceps Forearm Wrist 60.1 37.3 22.8 63.2 42.2 24.0 66.0 42.0 25.6 32.0 27.4 17.1 2 30.5 28.9 18.2 3 20.0 25.2 16.6 29.1 18.2 432.4 5 32.2 27.7 27.7 35.7 30.6 10.8 Analysis of Variance Table Model 1: x$BodyFat - x$Neck Model 2: x$BodyFat x$Neck+xSWeight + x$Height F Pr(>F) Res.Df RSS Df Sum of Sq 1 250 13348.1 2 248 9461.4 2 3886.7 50.939 <2.2e-16 *** Signif. codes: 00.001 0.01 0.05 0.11 (b) Let us consider just Hip, Forearm and Wrist as our predictors. How many possible linear models that predict BodyFat can one build? (e) Consider the two models Salary = 6366 +9.3 Age - 329.56 Male, R² = 0.135, ²= 1099 (1) and log(Salary) = 5.342 +0.012 Age - 0.321 Male, R² = 0.178, 8²=1.231. (2) (i) Interpret the coefficient for Male in each model. (ii) Would it be correct to say that the second model is preferred over the first? Explain your reasoning.

Glencoe Algebra 1, Student Edition, 9780079039897, 0079039898, 2018
18th Edition
ISBN:9780079039897
Author:Carter
Publisher:Carter
Chapter4: Equations Of Linear Functions
Section4.5: Correlation And Causation
Problem 2CYU

Related questions
Question
Transcribed Image Text:Below, we see a snippet of a dataset that consists of 128 observations and 15 variables. We present
two models describing the linear relationship between the BodyFat and other variables.
Density BodyFat Age Weight Height Neck Chest Abdomen Hip Thigh Knee Ankle
1 1.0708 12.3 23 154.25
85.2 94.5 59.0 37.3 21.9
2 1.0853
6.1 22 173.25
83.0 98.7 58.7 37.3
3 1.0414
87.9 99.2 59.6 38.9
4 1.0751
86.4 101.2
5 1.0340
100.0 101.9 63.2 42.2
6 1.0502
94.4 107.8 66.0 42.0
23.4
24.0
67.75 36.2 93.1
72.25 38.5 93.6
25.3 22 154.00 66.25 34.0 95.8
10.4 26 184.75 72.25 37.4 101.8
28.7 24 184.25 71.25 34.4 97.3
20.9 24 210.25 74.75 39.0 104.5
60.1 37.3
22.8
24.0
25.6
Biceps Forearm Wrist
1
32.0 27.4 17.1
2
30.5
28.9 18.2
3
28.8
25.2 16.6
32.4
29.4 18.2
5
32.2
27.7 17.7
6
35.7
30.6 18.8
Analysis of Variance Table
Model 1: x$BodyFat ~ x$Neck
Model 2: x$BodyFat
x$Neck + xSWeight + x$Height
F Pr (>F)
Res. Df
RSS Df Sum of Sq
1 250
13348.1
2
248 9461.4 2 3886.7 50.939 < 2.2e-16 ***
---
Signif. codes: 0*** 0.001 '**' 0.01 0.05 0.11
(b) Let us consider just Hip, Forearm and Wrist as our predictors. How many
possible linear models that predict BodyFat can one build?
(c) Consider the two models
Salary = 6366 +9.3 Age - 329.56 Male,
R² = 0.135,
² = 1099
(1)
and
log(Salary) = 5.342 +0.012 Age -0.321 Male, R² = 0.178, ²= 1.231. (2)
(i) Interpret the coefficient for Male in each model.
(ii) Would it be correct to say that the second model is preferred over the first?
Explain your reasoning.
Expert Solution
This question has been solved!
Explore an expertly crafted, step-by-step solution for a thorough understanding of key concepts.

Step by step
Solved in 2 steps

Recommended textbooks for you
Glencoe Algebra 1, Student Edition, 9780079039897…
Algebra
ISBN:
9780079039897
Author:
Carter
Publisher:
McGraw Hill

Big Ideas Math A Bridge To Success Algebra 1: Stu…
Algebra
ISBN:
9781680331141
Author:
HOUGHTON MIFFLIN HARCOURT
Publisher:
Houghton Mifflin Harcourt

Functions and Change: A Modeling Approach to Coll…
Algebra
ISBN:
9781337111348
Author:
Bruce Crauder, Benny Evans, Alan Noell
Publisher:
Cengage Learning
Glencoe Algebra 1, Student Edition, 9780079039897…
Algebra
ISBN:
9780079039897
Author:
Carter
Publisher:
McGraw Hill
Big Ideas Math A Bridge To Success Algebra 1: Stu…
Algebra
ISBN:
9781680331141
Author:
HOUGHTON MIFFLIN HARCOURT
Publisher:
Houghton Mifflin Harcourt
Functions and Change: A Modeling Approach to Coll…
Algebra
ISBN:
9781337111348
Author:
Bruce Crauder, Benny Evans, Alan Noell
Publisher:
Cengage Learning