(No. 1) Given: μ = 48, s = 17, n=25 and x = 65 STATISTICAL TOOL: T-TEST: ONE SAMPLE MEAN Formula: Solution: (No. 2) Given: x₁=7; x₂=5₁S₁² = 2; S₂² = 4; n₁ = 10; n₂ = 10 STATISTICAL TOOL: T-TEST: TWO SAMPLE MEANS Formula:
(No. 1) Given: μ = 48, s = 17, n=25 and x = 65 STATISTICAL TOOL: T-TEST: ONE SAMPLE MEAN Formula: Solution: (No. 2) Given: x₁=7; x₂=5₁S₁² = 2; S₂² = 4; n₁ = 10; n₂ = 10 STATISTICAL TOOL: T-TEST: TWO SAMPLE MEANS Formula:

MATLAB: An Introduction with Applications
6th Edition
ISBN:9781119256830
Author:Amos Gilat
Publisher:Amos Gilat
Chapter1: Starting With Matlab
Section: Chapter Questions
Problem 1P

Related questions
Question
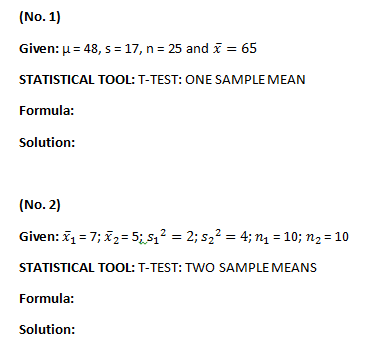
Transcribed Image Text:(No. 1)
Given: μ = 48, s = 17, n=25 and x = 65
STATISTICAL TOOL: T-TEST: ONE SAMPLE MEAN
Formula:
Solution:
(No. 2)
Given: x₁ = 7; x₂= 5; 5₁² = 2; 5₂² = 4; n₁ = 10; n₂ = 10
STATISTICAL TOOL: T-TEST: TWO SAMPLE MEANS
Formula:
Solution:
Expert Solution
This question has been solved!
Explore an expertly crafted, step-by-step solution for a thorough understanding of key concepts.

Step by step
Solved in 2 steps

Recommended textbooks for you
MATLAB: An Introduction with Applications
Statistics
ISBN:
9781119256830
Author:
Amos Gilat
Publisher:
John Wiley & Sons Inc

Probability and Statistics for Engineering and th…
Statistics
ISBN:
9781305251809
Author:
Jay L. Devore
Publisher:
Cengage Learning

Statistics for The Behavioral Sciences (MindTap C…
Statistics
ISBN:
9781305504912
Author:
Frederick J Gravetter, Larry B. Wallnau
Publisher:
Cengage Learning
MATLAB: An Introduction with Applications
Statistics
ISBN:
9781119256830
Author:
Amos Gilat
Publisher:
John Wiley & Sons Inc
Probability and Statistics for Engineering and th…
Statistics
ISBN:
9781305251809
Author:
Jay L. Devore
Publisher:
Cengage Learning
Statistics for The Behavioral Sciences (MindTap C…
Statistics
ISBN:
9781305504912
Author:
Frederick J Gravetter, Larry B. Wallnau
Publisher:
Cengage Learning

Elementary Statistics: Picturing the World (7th E…
Statistics
ISBN:
9780134683416
Author:
Ron Larson, Betsy Farber
Publisher:
PEARSON

The Basic Practice of Statistics
Statistics
ISBN:
9781319042578
Author:
David S. Moore, William I. Notz, Michael A. Fligner
Publisher:
W. H. Freeman

Introduction to the Practice of Statistics
Statistics
ISBN:
9781319013387
Author:
David S. Moore, George P. McCabe, Bruce A. Craig
Publisher:
W. H. Freeman