Between 1980 and 2012, the number of adults in a certain country who were overweight more than doubled from 17% to 36%. Use this information to answer parts a and b. (a) Construct graphic that is not misleading to depict this situation Choose the correct graph below OA. OB. Oc. OD. 60- 50- 60 10 10 1980 2012 1980 2012 1980 2012 1980 2012 (b) Construct a misleading graphic that makes it appear that the percent of overweight adults has more than tripled between 1980 and 2012. Choose the correct graph below OA. OB. Oc. OD. 40- 35- 10 15 1980 2012 1980 2012 1980 2012 1980 2012 Percentage steu
Between 1980 and 2012, the number of adults in a certain country who were overweight more than doubled from 17% to 36%. Use this information to answer parts a and b. (a) Construct graphic that is not misleading to depict this situation Choose the correct graph below OA. OB. Oc. OD. 60- 50- 60 10 10 1980 2012 1980 2012 1980 2012 1980 2012 (b) Construct a misleading graphic that makes it appear that the percent of overweight adults has more than tripled between 1980 and 2012. Choose the correct graph below OA. OB. Oc. OD. 40- 35- 10 15 1980 2012 1980 2012 1980 2012 1980 2012 Percentage steu

Algebra for College Students
10th Edition
ISBN:9781285195780
Author:Jerome E. Kaufmann, Karen L. Schwitters
Publisher:Jerome E. Kaufmann, Karen L. Schwitters
Chapter9: Polynomial And Rational Functions
Section9.5: Graphing Rational Functions
Problem 37PS

Related questions
Question
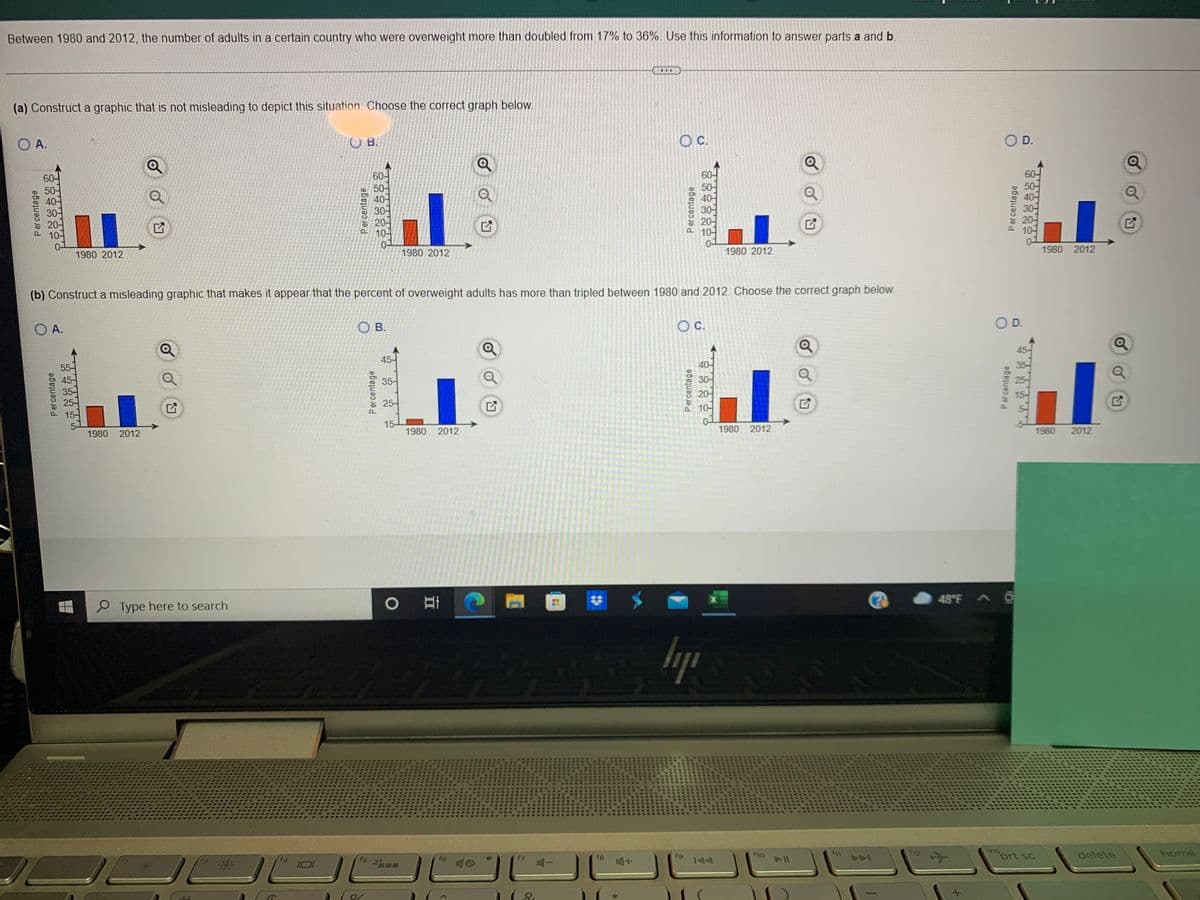
Transcribed Image Text:Between 1980 and 2012, the number of adults in a certain country who were overweight more than doubled from 17% to 36%. Use this information to answer parts a and b.
(a) Construct a graphic that is not misleading to depict this situation. Choose the correct graph beloW.
O A.
C.
O D.
OB.
60-
60-
50-
40-
30-
20-
10-
0-
60-
60-
50-
50-
40-
20-
10-
1980 2012
1980 2012
1980 2012
1980 2012
(b) Construct a misleading graphic that makes it appear that the percent of overweight adults has more than tripled between 1980 and 2012. Choose the correct graph below.
O A.
O B.
Oc.
OD.
45-
45-
55-
40-
35-
30어
20-
10-
25-
15-
0-
1980 2012
15-
1980 2012
1980 2012
1980
2012
48°F A
O Type here to search
lyp
ins
prt sc
fg
144
f12
delete
home
f5
f6
f8
AAA
Percentage
Percentage
Percentage
Percentage
Percentage
Percentage
Percentage
Percentage
20
Expert Solution
This question has been solved!
Explore an expertly crafted, step-by-step solution for a thorough understanding of key concepts.

This is a popular solution!

Trending now
This is a popular solution!

Step by step
Solved in 2 steps

Recommended textbooks for you
Algebra for College Students
Algebra
ISBN:
9781285195780
Author:
Jerome E. Kaufmann, Karen L. Schwitters
Publisher:
Cengage Learning

Algebra: Structure And Method, Book 1
Algebra
ISBN:
9780395977224
Author:
Richard G. Brown, Mary P. Dolciani, Robert H. Sorgenfrey, William L. Cole
Publisher:
McDougal Littell

Glencoe Algebra 1, Student Edition, 9780079039897…
Algebra
ISBN:
9780079039897
Author:
Carter
Publisher:
McGraw Hill
Algebra for College Students
Algebra
ISBN:
9781285195780
Author:
Jerome E. Kaufmann, Karen L. Schwitters
Publisher:
Cengage Learning
Algebra: Structure And Method, Book 1
Algebra
ISBN:
9780395977224
Author:
Richard G. Brown, Mary P. Dolciani, Robert H. Sorgenfrey, William L. Cole
Publisher:
McDougal Littell
Glencoe Algebra 1, Student Edition, 9780079039897…
Algebra
ISBN:
9780079039897
Author:
Carter
Publisher:
McGraw Hill

College Algebra (MindTap Course List)
Algebra
ISBN:
9781305652231
Author:
R. David Gustafson, Jeff Hughes
Publisher:
Cengage Learning