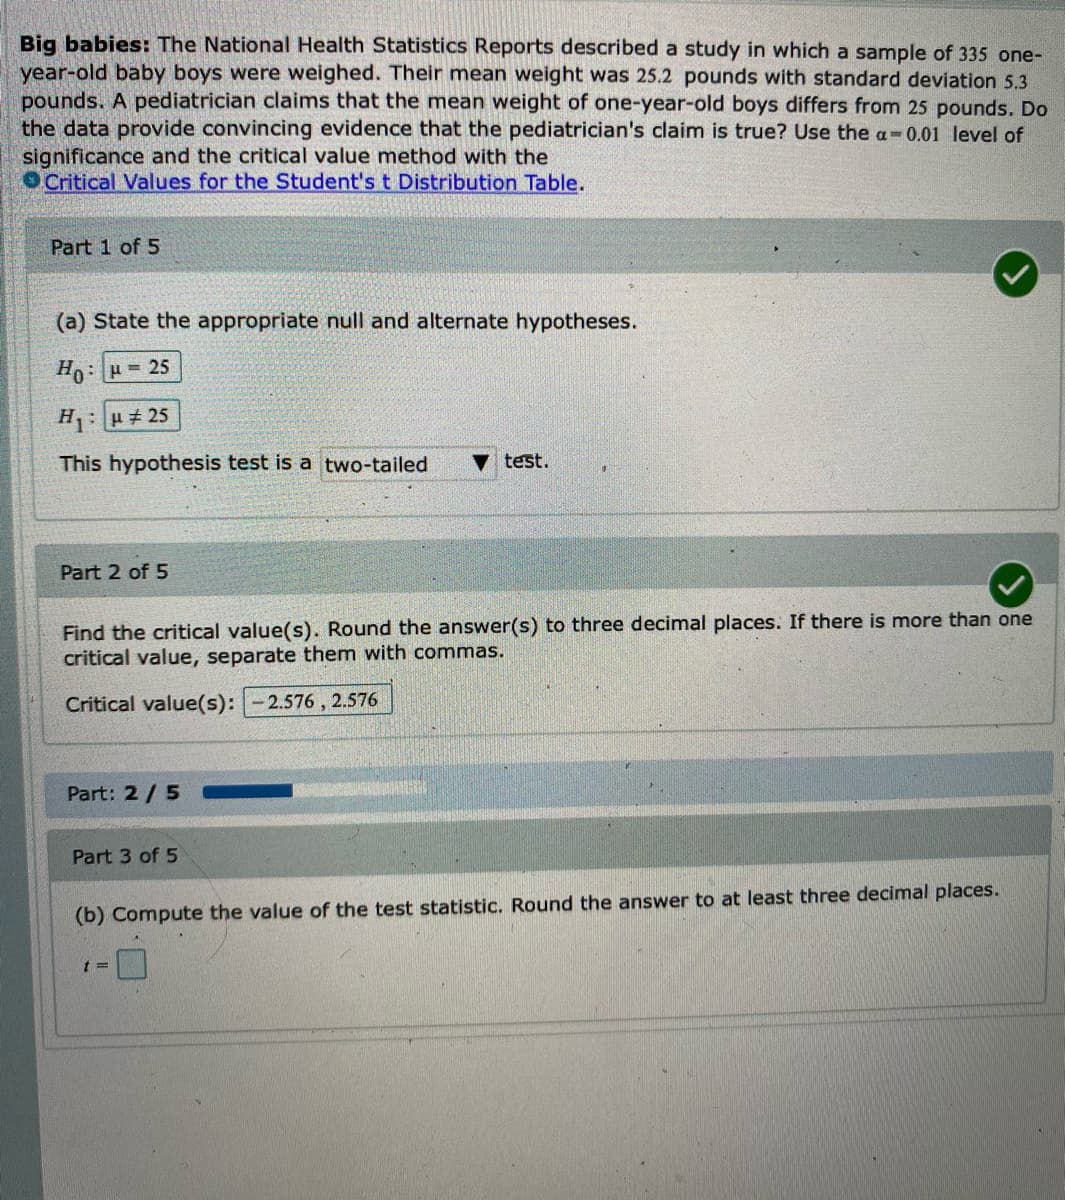
Big babies: The National Health Statistics Reports described a study in which a sample of 335 one- year-old baby boys were weighed. Their mean weight was 25.2 pounds with standard deviation 5.3 pounds. A pediatrician claims that the mean weight of one-year-old boys differs from 25 pounds. Do the data provide convincing evidence that the pediatrician's claim is true? Use the a-0.01 level of significance and the critical value method with the O Critical Values for the Student's t Distribution Table. Part 1 of 5 (a) State the appropriate null and alternate hypotheses. H: 25 H:H 25 This hypothesis test is a two-tailed v test. Part 2 of 5 Find the critical value(s). Round the answer(s) to three decimal places. If there is more than one critical value, separate them with commas. Critical value(s): 2.576 , 2.576 Part: 2/5 Part 3 of 5 (b) Compute the value of the test statistic. Round the answer to at least three decimal places.


Inverse Normal Distribution
The method used for finding the corresponding z-critical value in a normal distribution using the known probability is said to be an inverse normal distribution. The inverse normal distribution is a continuous probability distribution with a family of two parameters.
Mean, Median, Mode
It is a descriptive summary of a data set. It can be defined by using some of the measures. The central tendencies do not provide information regarding individual data from the dataset. However, they give a summary of the data set. The central tendency or measure of central tendency is a central or typical value for a probability distribution.
Z-Scores
A z-score is a unit of measurement used in statistics to describe the position of a raw score in terms of its distance from the mean, measured with reference to standard deviation from the mean. Z-scores are useful in statistics because they allow comparison between two scores that belong to different normal distributions.


Trending now
This is a popular solution!

Step by step
Solved in 2 steps with 1 images


