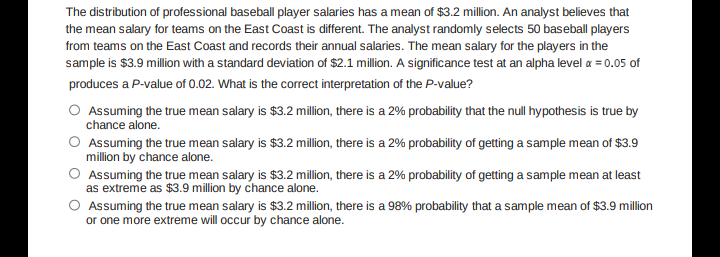
The distribution of professional baseball player salaries has a mean of $3.2 million. An analyst believes that the mean salary for teams on the East Coast is different. The analyst randomly selects 50 baseball players from teams on the East Coast and records their annual salaries. The mean salary for the players in the sample is $3.9 million with a standard deviation of $2.1 million. A significance test at an alpha level a = 0.05 of produces a P-value of 0.02. What is the correct interpretation of the P-value?
The distribution of professional baseball player salaries has a mean of $3.2 million. An analyst believes that the mean salary for teams on the East Coast is different. The analyst randomly selects 50 baseball players from teams on the East Coast and records their annual salaries. The mean salary for the players in the sample is $3.9 million with a standard deviation of $2.1 million. A significance test at an alpha level a = 0.05 of produces a P-value of 0.02. What is the correct interpretation of the P-value?

MATLAB: An Introduction with Applications
6th Edition
ISBN:9781119256830
Author:Amos Gilat
Publisher:Amos Gilat
Chapter1: Starting With Matlab
Section: Chapter Questions
Problem 1P

Related questions
Question
100%
Transcribed Image Text:The distribution of professional baseball player salaries has a mean of $3.2 million. An analyst believes that
the mean salary for teams on the East Coast is different. The analyst randomly selects 50 baseball players
from teams on the East Coast and records their annual salaries. The mean salary for the players in the
sample is $3.9 million with a standard deviation of $2.1 million. A significance test at an alpha level a = 0.05 of
produces a P-value of 0.02. What is the corect interpretation of the P-value?
O Assuming the true mean salary is $3.2 million, there is a 2% probability that the null hypothesis is true by
chance alone.
O Assuming the true mean salary is $3.2 million, there is a 2% probability of getting a sample mean of $3.9
million by chance alone.
O Assuming the true mean salary is $3.2 million, there is a 2% probability of getting a sample mean at least
as extreme as $3.9 million by chance alone.
O Assuming the true mean salary is $3.2 million, there is a 98% probability that a sample mean of $3.9 million
or one more extreme will occur by chance alone.
Expert Solution
This question has been solved!
Explore an expertly crafted, step-by-step solution for a thorough understanding of key concepts.

This is a popular solution!

Trending now
This is a popular solution!

Step by step
Solved in 2 steps

Recommended textbooks for you
MATLAB: An Introduction with Applications
Statistics
ISBN:
9781119256830
Author:
Amos Gilat
Publisher:
John Wiley & Sons Inc

Probability and Statistics for Engineering and th…
Statistics
ISBN:
9781305251809
Author:
Jay L. Devore
Publisher:
Cengage Learning

Statistics for The Behavioral Sciences (MindTap C…
Statistics
ISBN:
9781305504912
Author:
Frederick J Gravetter, Larry B. Wallnau
Publisher:
Cengage Learning
MATLAB: An Introduction with Applications
Statistics
ISBN:
9781119256830
Author:
Amos Gilat
Publisher:
John Wiley & Sons Inc
Probability and Statistics for Engineering and th…
Statistics
ISBN:
9781305251809
Author:
Jay L. Devore
Publisher:
Cengage Learning
Statistics for The Behavioral Sciences (MindTap C…
Statistics
ISBN:
9781305504912
Author:
Frederick J Gravetter, Larry B. Wallnau
Publisher:
Cengage Learning

Elementary Statistics: Picturing the World (7th E…
Statistics
ISBN:
9780134683416
Author:
Ron Larson, Betsy Farber
Publisher:
PEARSON

The Basic Practice of Statistics
Statistics
ISBN:
9781319042578
Author:
David S. Moore, William I. Notz, Michael A. Fligner
Publisher:
W. H. Freeman

Introduction to the Practice of Statistics
Statistics
ISBN:
9781319013387
Author:
David S. Moore, George P. McCabe, Bruce A. Craig
Publisher:
W. H. Freeman