Sucrose Solution Concentration 1 M Table 1 Group Data 0.5 Sucrose solution concentration (M) 2 1.5 1 Rate of pressure change (kPa/min) 1.78 x 10e-4 Class Average Data Rate of pressure change (kPa/min) 7.483 x 10e-6 4.42 x 10e-4 1.78 x 10e-4 2.41 x10e-5
Sucrose Solution Concentration 1 M Table 1 Group Data 0.5 Sucrose solution concentration (M) 2 1.5 1 Rate of pressure change (kPa/min) 1.78 x 10e-4 Class Average Data Rate of pressure change (kPa/min) 7.483 x 10e-6 4.42 x 10e-4 1.78 x 10e-4 2.41 x10e-5

Chapter6: Oral Medication Labels And Dosage Calculation
Section: Chapter Questions
Problem 9.3P

Related questions
Question
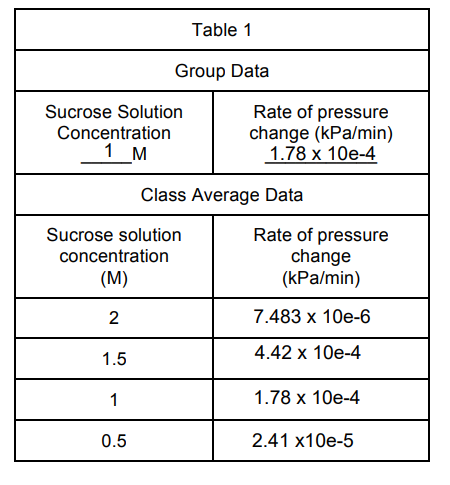
The experimental procedure is changed and a dialysis tubing cell is filled
with 10 mL of 0.8M sucrose solution and 5 mL of 1.0M sodium chloride
solution. It is then placed in a beaker containing distilled water. Predict the
rate of pressure change and explain your reasoning. Write on your own words. Do not copy and paste it from google or any other third party. See attached data.
Transcribed Image Text:Sucrose Solution
Concentration
1 M
Table 1
Group Data
0.5
Sucrose solution
concentration
(M)
2
1.5
1
Rate of pressure
change (kPa/min)
1.78 x 10e-4
Class Average Data
Rate of pressure
change
(kPa/min)
7.483 x 10e-6
4.42 x 10e-4
1.78 x 10e-4
2.41 x10e-5
Expert Solution
This question has been solved!
Explore an expertly crafted, step-by-step solution for a thorough understanding of key concepts.

This is a popular solution!

Trending now
This is a popular solution!

Step by step
Solved in 2 steps

Recommended textbooks for you

Principles Of Radiographic Imaging: An Art And A …
Health & Nutrition
ISBN:
9781337711067
Author:
Richard R. Carlton, Arlene M. Adler, Vesna Balac
Publisher:
Cengage Learning