BLE 3-1 Price of DVDS Maya Seema Rest of the Market Market $24 $20 8. 9. $16 11 11 $12 14 11 14 $8 17 14 20 fer to Table 3-1. It illustrates the demand schedules for DVDS of two individuals and the rest of the market. At a ce of $16, what quantity of DVDS would be demanded in the market? 12 22 31 39
BLE 3-1 Price of DVDS Maya Seema Rest of the Market Market $24 $20 8. 9. $16 11 11 $12 14 11 14 $8 17 14 20 fer to Table 3-1. It illustrates the demand schedules for DVDS of two individuals and the rest of the market. At a ce of $16, what quantity of DVDS would be demanded in the market? 12 22 31 39

Chapter7: Market Efficiency And Welfare
Section: Chapter Questions
Problem 8P

Related questions
Question
100%
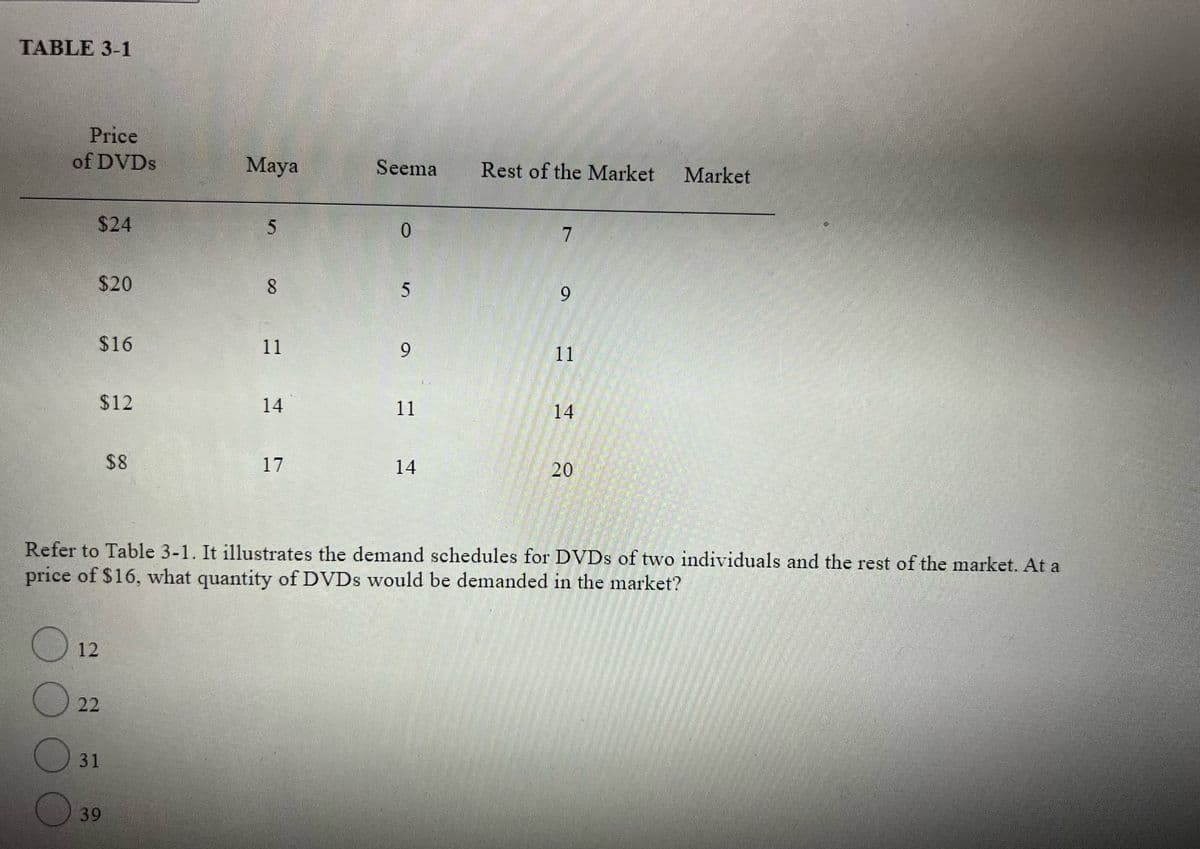
Transcribed Image Text:TABLE 3-1
Price
of DVDS
Maya
Seema
Rest of the Market
Market
$24
$20
6.
$16
11
11
$12
14
11
14
$8
17
14
20
Refer to Table 3-1. It illustrates the demand schedules for DVDS of two individuals and the rest of the market. At a
price of $16, what quantity of DVDS would be demanded in the market?
12
O 22
31
39
9.
8.
Expert Solution
This question has been solved!
Explore an expertly crafted, step-by-step solution for a thorough understanding of key concepts.

Step by step
Solved in 2 steps

Knowledge Booster


Learn more about
Need a deep-dive on the concept behind this application? Look no further. Learn more about this topic, economics and related others by exploring similar questions and additional content below.Recommended textbooks for you
Exploring Economics
Economics
ISBN:
9781544336329
Author:
Robert L. Sexton
Publisher:
SAGE Publications, Inc


Exploring Economics
Economics
ISBN:
9781544336329
Author:
Robert L. Sexton
Publisher:
SAGE Publications, Inc

Principles of Economics 2e
Economics
ISBN:
9781947172364
Author:
Steven A. Greenlaw; David Shapiro
Publisher:
OpenStax


Essentials of Economics (MindTap Course List)
Economics
ISBN:
9781337091992
Author:
N. Gregory Mankiw
Publisher:
Cengage Learning