Blooper's analysts have come up with the following revised estimates for its magh Range Initial investment Revenues Variable costs Fixed cost Working capital Pessimistic Optimistic +45% - 15% -25% + 25% 25% -25% 30% + 25% + 20% + 20% -
Blooper's analysts have come up with the following revised estimates for its magh Range Initial investment Revenues Variable costs Fixed cost Working capital Pessimistic Optimistic +45% - 15% -25% + 25% 25% -25% 30% + 25% + 20% + 20% -

Intermediate Financial Management (MindTap Course List)
13th Edition
ISBN:9781337395083
Author:Eugene F. Brigham, Phillip R. Daves
Publisher:Eugene F. Brigham, Phillip R. Daves
Chapter21: Supply Chains And Working Capital Management
Section: Chapter Questions
Problem 1Q: a. Working capital; net working capital; net operating working capital b. Current asset usage...

Related questions
Question
spreadsheet 10.1
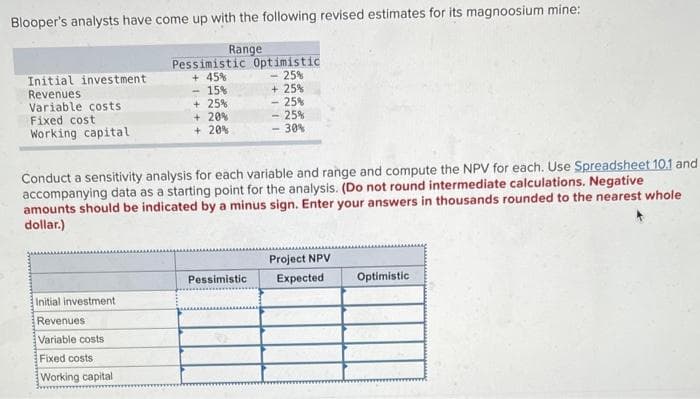
Transcribed Image Text:Blooper's analysts have come up with the following revised estimates for its magnoosium mine:
Range
Initial investment
Revenues
Variable costs
Fixed cost
Working capital
Initial investment
Pessimistic Optimistic
+45%
Revenues
Variable costs
Fixed costs
Working capital
- 15%
+ 25%
+ 20%
+ 20%
Conduct a sensitivity analysis for each variable and range and compute the NPV for each. Use Spreadsheet 10.1 and
accompanying data as a starting point for the analysis. (Do not round intermediate calculations. Negative
amounts should be indicated by a minus sign. Enter your answers in thousands rounded to the nearest whole
dollar.)
25%
+ 25%
- 25%
- 25%
30%
Pessimistic
Project NPV
Expected
Optimistic
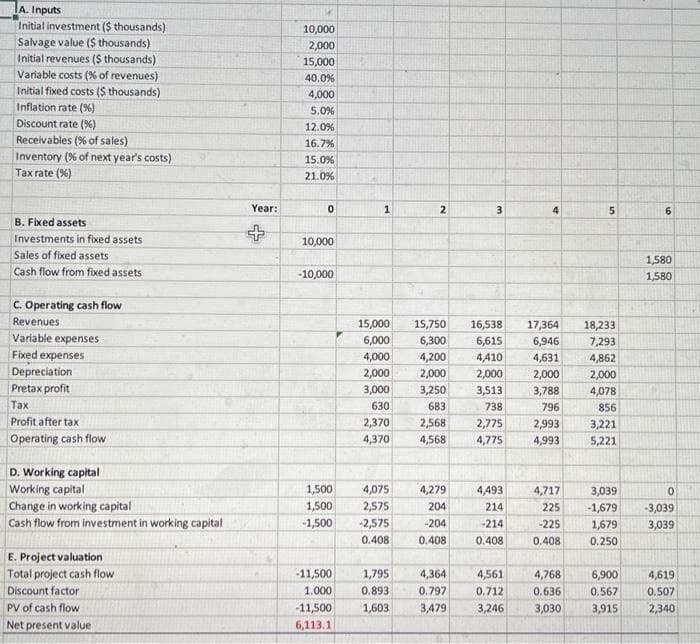
Transcribed Image Text:A. Inputs
Initial investment ($ thousands)
Salvage value ($ thousands)
Initial revenues ($ thousands)
Variable costs (% of revenues)
Initial fixed costs ($ thousands)
Inflation rate (%)
Discount rate (%)
Receivables (% of sales)
Inventory (% of next year's costs)
Tax rate (%)
B. Fixed assets
Investments in fixed assets
Sales of fixed assets
Cash flow from fixed assets
C. Operating cash flow
Revenues
Variable expenses
Fixed expenses
Depreciation
Pretax profit
Tax
Profit after tax
Operating cash flow
D. Working capital
Working capital
Change in working capital
Cash flow from investment in working capital
E. Project valuation
Total project cash flow
Discount factor
PV of cash flow
Net present value
Year:
10,000
2,000
15,000
40.0%
4,000
5.0%
12.0%
16.7%
15.0%
21.0%
0
10,000
-10,000
1,500
1,500
-1,500
1
15,000
6,000
4,000
2,000
3,000
630
2,370
4,370
4,075
2,575
-2,575
0.408
1,795
0.893
2
15,750 16,538
6,300
6,615
4,200
4,410
2,000
2,000
3,250
3,513
683
738
2,568
4,568
4,279
204
-204
0.408
-11,500
4,364
1.000
0.797
-11,500 1,603 3,479
6,113.1
3
2,775
4,775
4,493
214
-214
0.408
4,561
0.712
3,246
4
17,364
6,946
4,631
2,000
3,788
796
2,993
4,993
4,717
225
-225
0.408
4,768
0.636
3,030
5
18,233
7,293
4,862
2,000
4,078
856
3,221
5,221
3,039
-1,679
1,679
0.250
6,900
0.567
3,915
6
1,580
1,580
0
-3,039
3,039
4,619
0.507
2,340
Expert Solution
This question has been solved!
Explore an expertly crafted, step-by-step solution for a thorough understanding of key concepts.

This is a popular solution!

Trending now
This is a popular solution!

Step by step
Solved in 2 steps with 2 images

Knowledge Booster


Learn more about
Need a deep-dive on the concept behind this application? Look no further. Learn more about this topic, accounting and related others by exploring similar questions and additional content below.Recommended textbooks for you
Intermediate Financial Management (MindTap Course…
Finance
ISBN:
9781337395083
Author:
Eugene F. Brigham, Phillip R. Daves
Publisher:
Cengage Learning

Financial And Managerial Accounting
Accounting
ISBN:
9781337902663
Author:
WARREN, Carl S.
Publisher:
Cengage Learning,

Managerial Accounting
Accounting
ISBN:
9781337912020
Author:
Carl Warren, Ph.d. Cma William B. Tayler
Publisher:
South-Western College Pub
Intermediate Financial Management (MindTap Course…
Finance
ISBN:
9781337395083
Author:
Eugene F. Brigham, Phillip R. Daves
Publisher:
Cengage Learning
Financial And Managerial Accounting
Accounting
ISBN:
9781337902663
Author:
WARREN, Carl S.
Publisher:
Cengage Learning,
Managerial Accounting
Accounting
ISBN:
9781337912020
Author:
Carl Warren, Ph.d. Cma William B. Tayler
Publisher:
South-Western College Pub

Principles of Accounting Volume 2
Accounting
ISBN:
9781947172609
Author:
OpenStax
Publisher:
OpenStax College