Bluereef real estate agent wants to form a relationship between the prices of houses, how many bedrooms, House size in sq ft and Lot Size in sq ft. The data pertaining to 100 houses were processed using MINITAB and the following is an extract of the output obtained: The regression equation is Price = B + ¢Bedroom + yHouse Size + ALot Size Predictor Сoef SE Coef т P Constant 37718 14177 2.66 ** Bedrooms 2306 6994 0.33 0.742 House Size 74.3 52.98 0.164 Lot Size -4.36 17.02 -0.26 0.798 S= 25023 R-Sq=56.0% R-Sq(adj)=54.6% Source DF MS F P Regression 3 76501718347 25500572782 Residual Error 96 60109046053 626135896 Total 99 • Is y significantly different from -0.5? OPerform the F test at the 1% level, making sure to state the null and alternative hypotheses. Give an interpretation to the term “R-sq" and comment on its value.
Bluereef real estate agent wants to form a relationship between the prices of houses, how many bedrooms, House size in sq ft and Lot Size in sq ft. The data pertaining to 100 houses were processed using MINITAB and the following is an extract of the output obtained: The regression equation is Price = B + ¢Bedroom + yHouse Size + ALot Size Predictor Сoef SE Coef т P Constant 37718 14177 2.66 ** Bedrooms 2306 6994 0.33 0.742 House Size 74.3 52.98 0.164 Lot Size -4.36 17.02 -0.26 0.798 S= 25023 R-Sq=56.0% R-Sq(adj)=54.6% Source DF MS F P Regression 3 76501718347 25500572782 Residual Error 96 60109046053 626135896 Total 99 • Is y significantly different from -0.5? OPerform the F test at the 1% level, making sure to state the null and alternative hypotheses. Give an interpretation to the term “R-sq" and comment on its value.

Chapter3: Polynomial Functions
Section3.5: Mathematical Modeling And Variation
Problem 2ECP

Related questions
Question
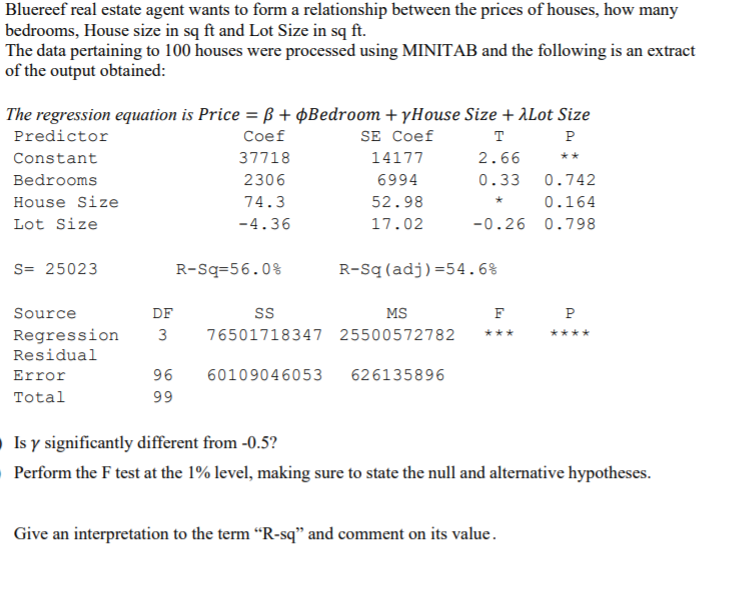
Transcribed Image Text:Bluereef real estate agent wants to form a relationship between the prices of houses, how many
bedrooms, House size in sq ft and Lot Size in sq ft.
The data pertaining to 100 houses were processed using MINITAB and the following is an extract
of the output obtained:
The regression equation is Price = B + ¢Bedroom + yHouse Size + ALot Size
Predictor
Сoef
SE Coef
т
P
Constant
37718
14177
2.66
**
Bedrooms
2306
6994
0.33 0.742
House Size
74.3
52.98
0.164
Lot Size
-4.36
17.02
-0.26 0.798
S= 25023
R-Sq=56.0%
R-Sq(adj)=54.6%
Source
DF
MS
F
P
Regression
3
76501718347 25500572782
Residual
Error
96
60109046053
626135896
Total
99
• Is y significantly different from -0.5?
Perform the F test at the 1% level, making sure to state the null and alternative hypotheses.
Give an interpretation to the term “R-sq" and comment on its value.
Expert Solution
This question has been solved!
Explore an expertly crafted, step-by-step solution for a thorough understanding of key concepts.

Step by step
Solved in 3 steps with 3 images

Recommended textbooks for you


Glencoe Algebra 1, Student Edition, 9780079039897…
Algebra
ISBN:
9780079039897
Author:
Carter
Publisher:
McGraw Hill
Glencoe Algebra 1, Student Edition, 9780079039897…
Algebra
ISBN:
9780079039897
Author:
Carter
Publisher:
McGraw Hill

Algebra & Trigonometry with Analytic Geometry
Algebra
ISBN:
9781133382119
Author:
Swokowski
Publisher:
Cengage

Algebra and Trigonometry (MindTap Course List)
Algebra
ISBN:
9781305071742
Author:
James Stewart, Lothar Redlin, Saleem Watson
Publisher:
Cengage Learning

Functions and Change: A Modeling Approach to Coll…
Algebra
ISBN:
9781337111348
Author:
Bruce Crauder, Benny Evans, Alan Noell
Publisher:
Cengage Learning