The admissions officer for Clearwater College developed the following estimated regression equation relating the final college GPA to the student's SAT mathematics score and high-school GPA. ŷ = -1.41 + 0.023521 +0.00486æ2 where a1 = high-school grade point average *3 = SAT mathemathics score y = final college grade point average Round test statistic values to 2 decimal places and all other values to 4 decimal places. Do not round your intermediate calculations. a. Complete the missing entries in this Excel Regression tool output. Enter negative values as negative numbers. SUMMARY OUTPUT Regression Statistics Multiple R R Square Adjusted R Square Standard Error Observations ANOVA df MS Significance F Regression 1.76209 Residual Total 9 1.88 Coefficients Standard Error t Stat p-value Intercept -1.4053 0.4848 K1 0.023467 0.0086666 0.00486 0.001077
The admissions officer for Clearwater College developed the following estimated regression equation relating the final college GPA to the student's SAT mathematics score and high-school GPA. ŷ = -1.41 + 0.023521 +0.00486æ2 where a1 = high-school grade point average *3 = SAT mathemathics score y = final college grade point average Round test statistic values to 2 decimal places and all other values to 4 decimal places. Do not round your intermediate calculations. a. Complete the missing entries in this Excel Regression tool output. Enter negative values as negative numbers. SUMMARY OUTPUT Regression Statistics Multiple R R Square Adjusted R Square Standard Error Observations ANOVA df MS Significance F Regression 1.76209 Residual Total 9 1.88 Coefficients Standard Error t Stat p-value Intercept -1.4053 0.4848 K1 0.023467 0.0086666 0.00486 0.001077

Chapter4: Linear Functions
Section: Chapter Questions
Problem 30PT: For the following exercises, use Table 4 which shows the percent of unemployed persons 25 years or...

Related questions
Question
please assist
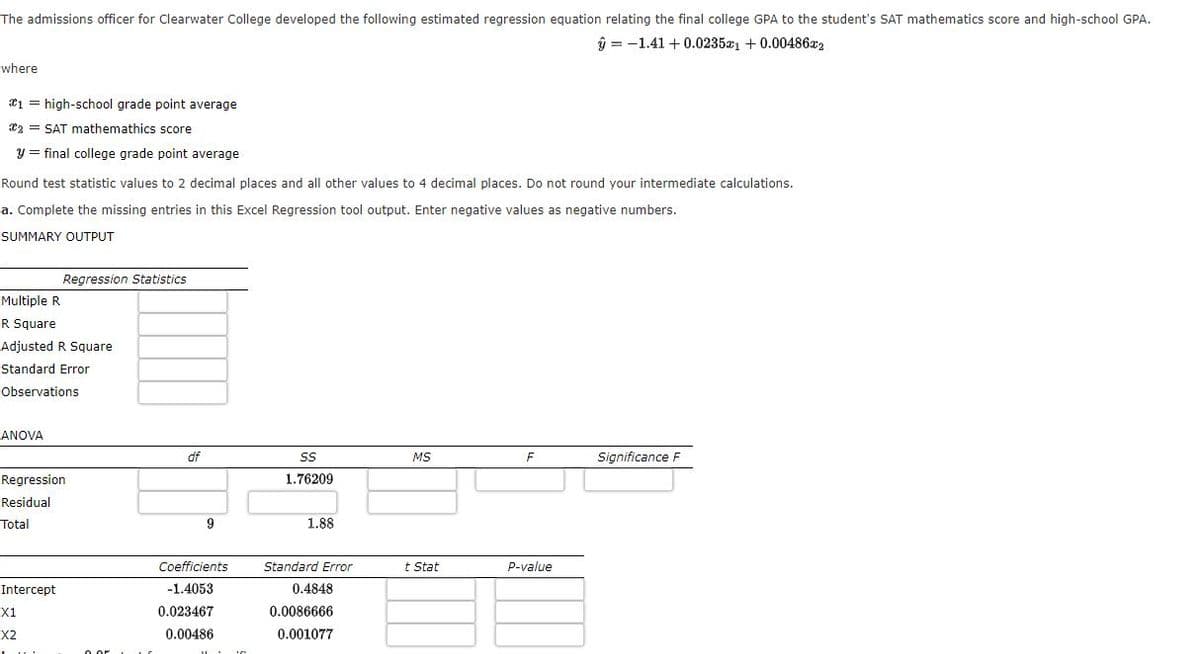
Transcribed Image Text:The admissions officer for Clearwater College developed the following estimated regression equation relating the final college GPA to the student's SAT mathematics score and high-school GPA.
ŷ = -1.41 + 0.0235a1 + 0.00486x2
where
*1 = high-school grade point average
23 = SAT mathemathics score
y = final college grade point average
Round test statistic values to 2 decimal places and all other values to 4 decimal places. Do not round your intermediate calculations.
a. Complete the missing entries in this Excel Regression tool output. Enter negative values as negative numbers.
SUMMARY OUTPUT
Regression Statistics
Multiple R
R Square
Adjusted R Square
Standard Error
Observations
ANOVA
df
MS
cance F
Regression
1.76209
Residual
Total
9
1.88
Coefficients
Standard Error
t Stat
p-value
Intercept
-1.4053
0.4848
X1
0.023467
0.0086666
X2
0.00486
0.001077
Expert Solution
Step 1
To complete the missing entries in this Excel Regression tool output.
F-statistic is given by the formula:
Using Excel function "F.DIST.RT(52.31,2,7)", p-value obtained is 0.0001

Trending now
This is a popular solution!

Step by step
Solved in 2 steps

Knowledge Booster


Learn more about
Need a deep-dive on the concept behind this application? Look no further. Learn more about this topic, statistics and related others by exploring similar questions and additional content below.Recommended textbooks for you

Functions and Change: A Modeling Approach to Coll…
Algebra
ISBN:
9781337111348
Author:
Bruce Crauder, Benny Evans, Alan Noell
Publisher:
Cengage Learning
Functions and Change: A Modeling Approach to Coll…
Algebra
ISBN:
9781337111348
Author:
Bruce Crauder, Benny Evans, Alan Noell
Publisher:
Cengage Learning