BMundela Company produces glass boards. Recently the ocompany received many complaints from its customers. The customers are not happy with the glass boards as they were inconsistent. The customers relationship manager discussed the issue with the quality control manager to figure out the cause of the inconsistency of the product. Prior to defining the cause, the quality control manger decided with his team to go through the process and make sure if they are under control. Out of 10 process, three processes have been selected for inspection. Process Three: Packaging In this process the quality controller selects randomly group of boxes and make sure if the box confima to the standards or not. The collected data is presented in the table below Number Number Number Number of Boxes confirms the of Boxes confirms the of Boxes confirms the of Boxes confirms Number Number Number Number of Boxes Selected Standards of Boxes Selected Standards Sample of Boxes Selected Standards Sample of Boxes Selected Standards the Sample Sample 1 190 180 11 215 190 21 215 190 31 180 170 190 180 12 205 195 22 205 195 32 180 180 200 185 13 205 190 23 205 190 33 175 165 4 200 190 14 195 180 24 195 180 34 170 160 190 170 15 195 190 25 195 190 35 175 165 195 180 16 210 185 26 210 185 36 190 180 7 195 185 17 205 190 27 205 190 37 180 180 200 190 18 210 195 28 210 195 38 170 160 200 180 19 210 200 29 210 200 39 185 180 10 180 170 20 210 200 30 210 200 40 190 170


Given the data collected, you are requested to help the
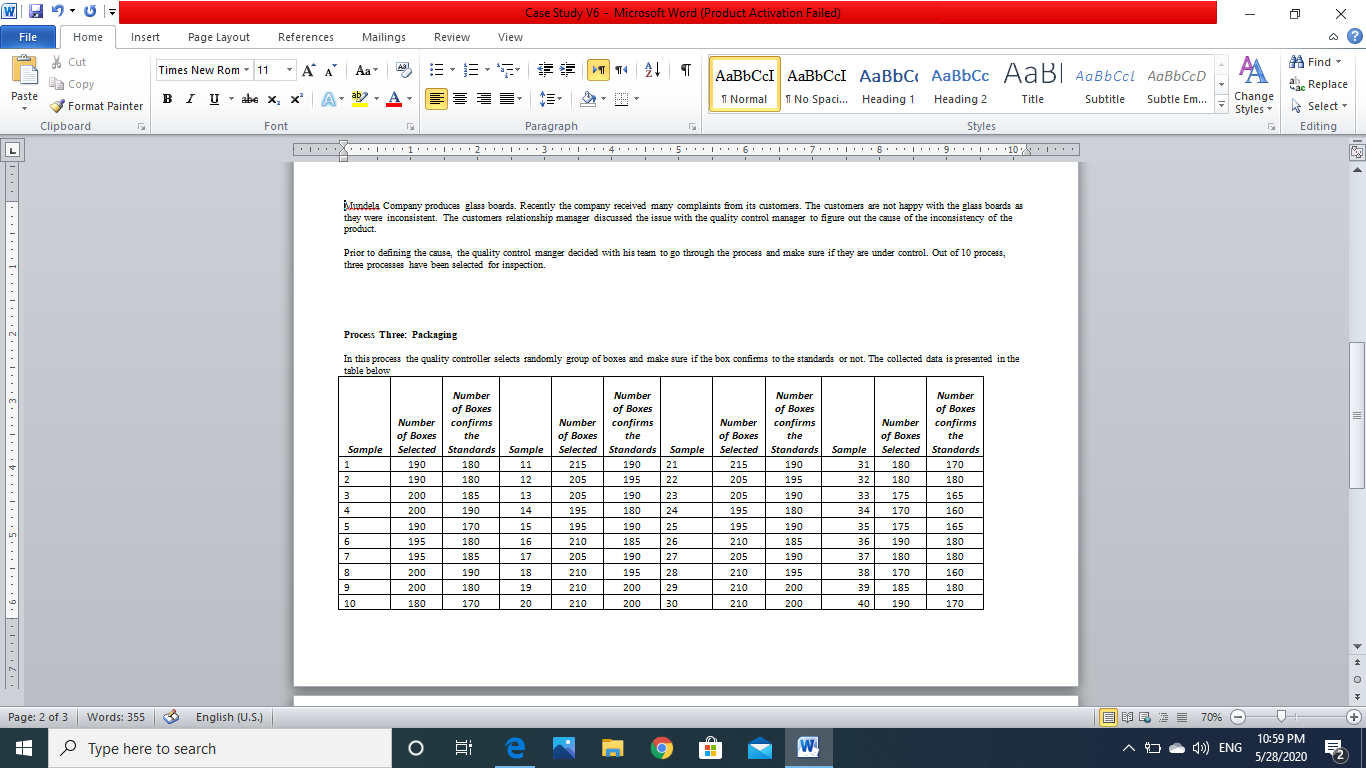
The given data can be summarized as follows:
|
Sample |
Number of Boxes Selected |
Number of boxes confirms the standards |
Number of defectives |
Proportion of defectives |
|
1 |
190 |
180 |
10 |
10/190 = 0.05263158 |
|
2 |
190 |
180 |
10 |
0.05263158 |
|
3 |
200 |
185 |
15 |
0.075 |
|
4 |
200 |
190 |
10 |
0.05 |
|
5 |
190 |
170 |
20 |
0.10526316 |
|
6 |
195 |
180 |
15 |
0.07692308 |
|
7 |
195 |
185 |
10 |
0.05128205 |
|
8 |
200 |
190 |
10 |
0.05 |
|
9 |
200 |
180 |
20 |
0.1 |
|
10 |
180 |
170 |
10 |
0.05555556 |
|
11 |
215 |
190 |
25 |
0.11627907 |
|
12 |
205 |
195 |
10 |
0.04878049 |
|
13 |
205 |
190 |
15 |
0.07317073 |
|
14 |
195 |
180 |
15 |
0.07692308 |
|
15 |
195 |
190 |
5 |
0.02564103 |
|
16 |
210 |
185 |
25 |
0.11904762 |
|
17 |
205 |
190 |
15 |
0.07317073 |
|
18 |
210 |
195 |
15 |
0.07142857 |
|
19 |
210 |
200 |
10 |
0.04761905 |
|
20 |
210 |
200 |
10 |
0.04761905 |
|
21 |
215 |
190 |
25 |
0.11627907 |
|
22 |
205 |
195 |
10 |
0.04878049 |
|
23 |
205 |
190 |
15 |
0.07317073 |
|
24 |
195 |
180 |
15 |
0.07692308 |
|
25 |
195 |
190 |
5 |
0.02564103 |
|
26 |
210 |
185 |
25 |
0.11904762 |
|
27 |
205 |
190 |
15 |
0.07317073 |
|
28 |
210 |
195 |
15 |
0.07142857 |
|
29 |
210 |
200 |
10 |
0.04761905 |
|
30 |
210 |
200 |
10 |
0.04761905 |
|
31 |
180 |
170 |
10 |
0.05555556 |
|
32 |
180 |
180 |
0 |
0 |
|
33 |
175 |
165 |
10 |
0.05714286 |
|
34 |
170 |
160 |
10 |
0.05882353 |
|
35 |
175 |
165 |
10 |
0.05714286 |
|
36 |
190 |
180 |
10 |
0.05263158 |
|
37 |
180 |
180 |
0 |
0 |
|
38 |
170 |
160 |
10 |
0.05882353 |
|
39 |
185 |
180 |
5 |
0.02702703 |
|
40 |
190 |
170 |
20 |
0.10526316 |
|
Total |
7855 |
|
505 |
P bar = 0.06429 |
Following formula can be used to determine the control limits for the p chart
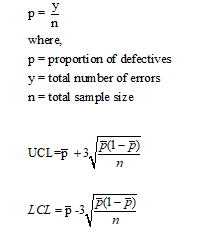
Now, since the sample size varies for every sample. The control limits will be calculated for each sample.
|
Sample |
Number of Boxes Selected |
Number of boxes confirms the standards |
Number of defectives |
Proportion of defectives |
LCL |
UCL |
|
1 |
190 |
180 |
10 |
0.05263158 |
0.004033 |
0.101231 |
|
2 |
190 |
180 |
10 |
0.05263158 |
0.004033 |
0.101231 |
|
3 |
200 |
185 |
15 |
0.075 |
0.019126 |
0.130874 |
|
4 |
200 |
190 |
10 |
0.05 |
0.003767 |
0.096233 |
|
5 |
190 |
170 |
20 |
0.10526316 |
0.03847 |
0.172056 |
|
6 |
195 |
180 |
15 |
0.07692308 |
0.019676 |
0.13417 |
|
7 |
195 |
185 |
10 |
0.05128205 |
0.003895 |
0.098669 |
|
8 |
200 |
190 |
10 |
0.05 |
0.003767 |
0.096233 |
|
9 |
200 |
180 |
20 |
0.1 |
0.03636 |
0.16364 |
|
10 |
180 |
170 |
10 |
0.05555556 |
0.004336 |
0.106775 |
|
11 |
215 |
190 |
25 |
0.11627907 |
0.050693 |
0.181865 |
|
12 |
205 |
195 |
10 |
0.04878049 |
0.003646 |
0.093915 |
|
13 |
205 |
190 |
15 |
0.07317073 |
0.018606 |
0.127736 |
|
14 |
195 |
180 |
15 |
0.07692308 |
0.019676 |
0.13417 |
|
15 |
195 |
190 |
5 |
0.02564103 |
0 |
0.059598 |
|
16 |
210 |
185 |
25 |
0.11904762 |
0.052005 |
0.18609 |
|
17 |
205 |
190 |
15 |
0.07317073 |
0.018606 |
0.127736 |
|
18 |
210 |
195 |
15 |
0.07142857 |
0.018113 |
0.124744 |
|
19 |
210 |
200 |
10 |
0.04761905 |
0.003532 |
0.091706 |
|
20 |
210 |
200 |
10 |
0.04761905 |
0.003532 |
0.091706 |
|
21 |
215 |
190 |
25 |
0.11627907 |
0.050693 |
0.181865 |
|
22 |
205 |
195 |
10 |
0.04878049 |
0.003646 |
0.093915 |
|
23 |
205 |
190 |
15 |
0.07317073 |
0.018606 |
0.127736 |
|
24 |
195 |
180 |
15 |
0.07692308 |
0.019676 |
0.13417 |
|
25 |
195 |
190 |
5 |
0.02564103 |
0 |
0.059598 |
|
26 |
210 |
185 |
25 |
0.11904762 |
0.052005 |
0.18609 |
|
27 |
205 |
190 |
15 |
0.07317073 |
0.018606 |
0.127736 |
|
28 |
210 |
195 |
15 |
0.07142857 |
0.018113 |
0.124744 |
|
29 |
210 |
200 |
10 |
0.04761905 |
0.003532 |
0.091706 |
|
30 |
210 |
200 |
10 |
0.04761905 |
0.003532 |
0.091706 |
|
31 |
180 |
170 |
10 |
0.05555556 |
0.004336 |
0.106775 |
|
32 |
180 |
180 |
0 |
0 |
0 |
0 |
|
33 |
175 |
165 |
10 |
0.05714286 |
0.004504 |
0.109782 |
|
34 |
170 |
160 |
10 |
0.05882353 |
0.004685 |
0.112962 |
|
35 |
175 |
165 |
10 |
0.05714286 |
0.004504 |
0.109782 |
|
36 |
190 |
180 |
10 |
0.05263158 |
0.004033 |
0.101231 |
|
37 |
180 |
180 |
0 |
0 |
0 |
0 |
|
38 |
170 |
160 |
10 |
0.05882353 |
0.004685 |
0.112962 |
|
39 |
185 |
180 |
5 |
0.02702703 |
0 |
0.062794 |
|
40 |
190 |
170 |
20 |
0.10526316 |
0.03847 |
0.172056 |
|
Total |
7855 |
505 |
0.06429026 |

Step by step
Solved in 3 steps with 2 images


