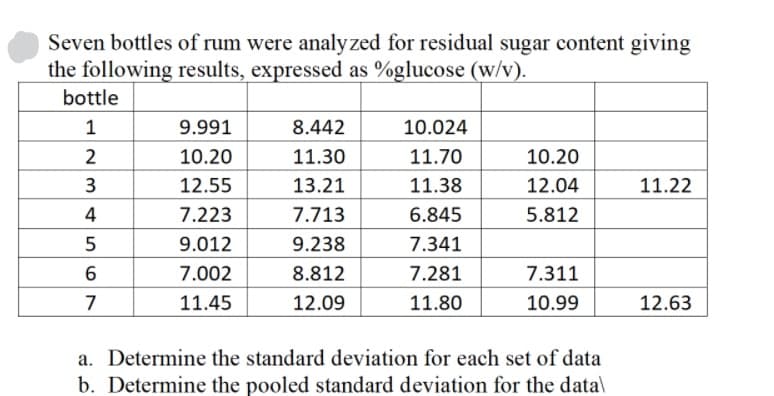
bottle 1 9.991 8.442 10.024 2 10.20 11.30 11.70 10.20 3 12.55 13.21 11.38 12.04 11.22 4 7.223 7.713 6.845 5.812 9.012 9.238 7.341 7.002 8.812 7.281 7.311 7 11.45 12.09 11.80 10.99 12.63 a. Determine the standard deviation for each set of data b. Determine the pooled standard deviation for the data\


Q: Arsenic Amounts Arkansas California Texas | 4.79 4.87 4.99 5.39 5.41 5.35 5.59 5.60 5.56 5.88 5.96…
A: Since, we only do up to three sub parts of a problem, we'll be doing the first three only. Please…
Q: Paulhas$2,400inasavingsaccountearning3.4%simpleinterest.Howmuch…
A: Given information P=$2,400 r=3.4% ⇒r=3.4100=0.034 t=5 years The formula for the amount for simple…
Q: Total Males 27,437,246 Total Females 27 231,086 Females aged 15-44 years 12,913,036 Total deaths…
A:
Q: leek Price/Package Packages Sold 1 $4.00 1,000 2 $4.00 1,000 3 $3.00 3,000 4 $2.00 10,000
A: We will use the concept of weighted average in this case. The formula for weighted average…
Q: Date Apple Adjusted Stock Price P&G Adjusted Stock Price 6/1/2013 44.44 65.71 7/1/2013 50.71 68.54…
A: Given data represents date wise Apple Adjusted Stock Price and P&G Adjusted Stock Price . Use…
Q: 4285 564 1278 205 3920 2066 604 209 602 1379 2574 14 349 3770 99 1009 4152 478 726 510 318 737 3032…
A: Data :…
Q: Each additional 100 POINTS increase SAT score is associated with a _____________ increase in the…
A: The independent variable is Combined SAT Score. The dependent variable is % Attend 4-Year College.…
Q: Date in June Rejects 3 10 12 16 6 10 12 10 21 11 17 12 12 13 13 14 14 17 14 18 20 4, 5.
A: total number of units = 800
Q: 4285 564 1278 205 3920 2066 2574 604 209 602 1379 14 349 3770 99 1009 4152 478 726 510
A: Given : mean = 1203.84 Standard deviation = 1172.81
Q: Thousands of Persons nd ter Third Fourth Annual Quarter Quarter Visitors 1,047.3 939.5 3,934.5…
A: *Answer: Given details: Find the Given details for Seasonal and trend factors: Given details:…
Q: In a given year we insure 18 million vehicles. During that same time we had 1,368,0000 claims. What…
A: Number of vehicles insured: 18million=18000000 Number of claims=13680000
Q: Birthday of Students by Month 12 10 8. 6. 00 4) Numberof Students
A: the data represent the number of students whose birthday fall each month . the given data is…
Q: Listed below are amounts (in millions of dollars) collected from parking meters by a security…
A: Consider the below data for the calculation. Security Service Company Other Companies 1.5…
Q: Population: 312,799,495 Deaths: 2,515,458 Women Aged 15-44: 61,488,227 Motor vehicle deaths: 33,783…
A: Hey, since there are multiple subparts posted, we will answer first three subparts. If you want any…
Q: 0.352 0.584 6.251 7815 9.348 11.345 12.838 0.711 1.064 7.779 9488 11.143 13277 14.860 1.145 1.610…
A:
Q: Evaluate the following: 1. 10! 2. 5!3! 3. (10-2 10! 4. 6! 5. 7! +4!
A: Given1.10!
Q: On October 1, Ebony Ernst organized Ernst Consulting; on October 3, the owner contributed $84,470 in…
A: We will make a table for income statement
Q: Assessed Value Heating Area Age 184.4 2.00 3.42 177.4 1.71 11.50 175.7 1.45 8.33 185.9 1.76 0.00…
A: The provided data set is: Assessed Value Heating Area Age184.4 2.00 3.42177.4 1.71 11.50175.7 1.45…
Q: 15,66 13.72 7. 13.18 15.04 16 10 14.26 12.42 12 13.78 12.84 11 13 14 15.3 S6
A: Given, X Y 5 15.66 6 13.72 7 13.18 8 15.04 9 16 10 14.26 11 12.42 12 13.78 13…
Q: Assumeing that math test scores are normally distributed with a mean of 200 and a standard deviation…
A: Let X denote the math test scores and it follows normal distribution with a mean of 200 and a…
Q: According to The Sydney Morning Herald, as of 1:00 p.m. June 6, 2018 (the day before Donato’s…
A: Solution: Given information: n= 7700 Sample size p^= 0.74 Sample proportion
Q: 15. FILE Listed below are the commissions earned ($000) last year by the 15 . representatives at…
A: Measures of central tendency help you find the middle, or the average, of a data set. The 3 most…
Q: The accompanying table lists the word counts measured from men and women in 58 couple relationships.…
A: Step-by-step software procedure to draw scatter plot using Excel software is given below: Enter the…
Q: Male 18 years and over 18 to 24 years 36,076 4,819 31,257 3,416 3,178 2,951 2,740 2,940 3,057 3,116…
A: P(Male) is the proportion of male in the population=Total number of malesTotal number of people.…
Q: 51 0.2 0.04 1. 0.006 4. 0.06 3. 0.016 2. 0.008 5. 0.08 5. 713 3 11/3 13/3 5 1. 14/3 4. 17/3 3. 16/3…
A: To determine: The next number of the following: (4) 5 , 1, 0.2, 0.04, __. (5) 73, 3, 113, 133, 5,…
Q: 3 months 6 months 9 months 1.00 5.43 5.20 1.74 3.06 5.68 1.03 2.52 3.07 4.23 3.96 5.11 1.25 6.32…
A: An ANOVA is a statistical tool used to test the population mean of two or more than two groups.…
Q: Set 1: 8 8.5 8.5 8.5 9 9 9.5 9.5 10 10 10 10 10 10 10 10.5 10.5 10.5 10.5 12 12…
A: Given four set of data Set-1X__1=10.61S1=1.45n1=31 Set-2X__2=11.03S2=1.20n2=31…
Q: 2016 101 86 109 131 18 157 Electronics 261 300 330 132 Fashion Supermarket 463 616 801 376 Other Mar…
A:
Q: Monthly Sales 6267.19 7058.06 7119.5 7147.18 7198.52 7298.09 7325.7 7335.68 7355.97 7481.05 7490.23…
A: Given data : Monthly Sales 6267.19 7058.06 7119.5 7147.18 7198.52 7298.09 7325.7…
Q: 0.40 [0.20 0.90 0.03 0.74 0.78 0.99 0.01 0.70 0.73 0.66 0.30 0.70 0.51 0.29 0.88 0.93 0.02 B = 0.71…
A: Note:- For a non singular matrix say A, inverse is A-1=1Aadj.A If A is singular matrix then inverse…
Q: Petal length (in cm) of Iris virginica: x1; n1 = 36 5.0 5.6 6.1 6.1 5.1 5.5 5.3 5.5 6.9 5.0 4.9 6.0…
A: Given: Petal length (in cm) of Iris virginica: x1; n1 = 36 5.0 5.6 6.1 6.1 5.1 5.5 5.3 5.5 6.9…
Q: $16,944 at 3.9% for 9 months O $17,384.54; $440.54 O $550.68; $17,494.68 O $17.439.61; $495.61 O…
A:
Q: in the past 12 persons had sex with in months the past 12 months
A: Given as,
Q: Petal length (in cm) of Iris virginica: x1; n1 = 35 5.2 5.8 6.2 6.1 5.1 5.5 5.3 5.5 6.9 5.0 4.9 6.0…
A: Given Information: The data represents the petal lengths for independent samples of two species: To…
Q: Sale Price 12400 10400 12100 10000 11000 8895 7675 9975 6350 10470 9895 11250 8795 12500 9340 10150…
A: 1. The manager wants to test whether the mean price of used cars s $10,192. One can assume that The…
Q: Fill in the missing values for this ANOVA summary table: S.S. d.f. M.S. F Between 7.384…
A: Let the following formulas be considered to complete the given table : F=MSbetweenMSwithin…
Q: Population 15,855 28,951 142,547 2,801,561 2,714,664 2,503,344 1,999,877 1,689,908 1,523,665…
A: Given, City population jan feb mar Arvada 15,855 10,505 24,556 12,564 Centenntial 28,951…
Q: Regular Coke Diet Coke Regular Pepsi Diet Pepsi 0.8192 0.7773 0.8258 0.7925 0.8150 0.7758 0.8156…
A: The data set is: Regular Coke Diet Coke 0.8192 0.7773 0.815 0.7758 0.8163…
Q: Refer to the accompanying data table, which shows the amounts of nicotine (mg per cigarette) in…
A:
Q: One question from a survey was "How many credit cards do you currently have?" The results of the…
A: The formula of the standard deviation is,
Q: Given the company’s performance record and based on the empirical rule of normal distribution (also…
A: Given: Data of monthly sales of the company.
Q: Program Per-Year Tuition ($) 63,487 67,360 67,647 68,670 66,587 65,525 66,987 68,256 64,931 62,794…
A: Note: Since you have posted a question with multiple subparts, we will solve the first three…
Q: Lower class 0.08 0.33 0.58 0.75 0.83 1 1 1 1 1 1 1 2 2 2 2 2 2 2 2 3 3 3 3…
A: Excel Procedure is given below: Steps to construct box plot in Excel: Select the data for lower…
Q: fepro paer integal!
A:
Q: The accompanying table lists the numbers of words spoken in a day by each member of 58 different…
A: Solution : Part a) We have given data. In part a) We have to test the claim that among couples,…
Q: 'collar' measurements: 14.5 15.0 15,5 14.0 16.0 16.5 13.5 12.5 13.0 Mid-value (inches) : 66 29 30 63…
A:
Q: 2016 86 109 101 131 157 66 Electronics 300 330 132 261 Fashion Supermarket 616 801 376 463 Other Mar…
A: From the given graph, we can see that 300 agents bought fashion.
Q: 0.485 0.599 0.794 0.989 1.239 1.690 2.167 2.833 3.822 5.493 0.710 0.972 0.857 1.104 1.344 1.647…
A: *answer:


Trending now
This is a popular solution!

Step by step
Solved in 4 steps

- A researcher reports an F-ratio with dfbetween = 2 and dfwithin = 30 for an independent-measures ANOVA. a. How many treatment conditions were compared in the experiment? b. How many subjects participated ion the experiment?Calculate the average values of the Cp and Cpk capabil-ity indices for the BOD data , assuming that LSL=5 mg/L and USL=35 mg/L. Do these val-ues of the indices indicate that the process performance is satisfactory?Interpret the following statement regarding the statistical findings of a research study. “61% (n = 36) of recipients of the low-carbohydrate diet and 23% (n = 14) of recipients of the low-fat diet completed the study and lost greater than 10% of their initial body weight (P < 0.001).” Number of participants who completed the study and lost greater than 10% of their body weight: P-value: Does this p-value indicate a statistically-significant difference in the average weight loss between the two groups:
- A 2017 survey of over 5,000 college graduates found that the average graduated from a four-year college or university had an average student loan debt of $28,650 (s.d. = $3,280). Assuming that educational debt is normally distributed, calculate the percentile rank of a recent graduate who graduated with $35,636 in education-related debt.The Board of Transportation and Safety (BTS) wants to examine the safety mechanisms of A, B, and C-class cars. Samples of 10 cars for each class were used. The board members collect the pressure exerted overall on the driver’s body during an impact test. Assume alpha of 0.05. What is dfbetween = ? What is dfwithin = ? What is the critical test statistic: ? A B C 27 21 48 13 23 39 11 10 22 15 27 30 34 34 31 n(A) = 5 n(B) = 5 n(B) = 5 T(A)=100 T(B)=115 T(C)=170 SS(A)=86 SS(B)=135 SS(C)=151 What is the MSbetween=? What is the MSwithin=? What is the calculated test statistic? Given the values of your critical test statistic and calculated test statistic, do you reject the null?Much concern has been expressed regarding the practice of using nitrates as meat preservatives. In one study involving possible effects of these chemicals, bacteria cultures were grown in a medium containing nitrates. The rate of uptake of radio-labeled amino acid (in dpm, disintegrations per minute) was then determined for each culture, yielding the following observations. 7,255 6,875 9,637 6,863 9,098 5,846 8,954 7,979 7,068 7,498 7,882 8,179 7,528 8,728 7,469 Suppose that it is known that the mean rate of uptake for cultures without nitrates is 8,000. Do the data suggest that the addition of nitrates results in a decrease in the mean rate of uptake? Test the appropriate hypotheses using a significance level of 0.10. Find the test statistic and P-value. (Use technology to calculate the P-value. Round your test statistic to two decimal places and your P-value to three decimal places.) t= P-value= State your conclusion. Reject H0. We have convincing evidence that the mean rate of…
- A sample of 124 kissing couples were observed, with 44 of them leaning their heads to the left. Use these sample data to test whether or not the population proportion of kissing couples who lean their heads to the left differs from 1/3. What is the z and p-value?A paper gave summary quantities for blood lead level (in micrograms per deciliter) for a sample of whites and a sample of African Americans. Data consistent with the given summary quantities is given below. Whites (W) 8.3 0.9 2.9 5.6 5.8 5.4 1.2 1.0 1.4 2.1 1.3 5.3 8.4 6.6 5.2 3.4 2.9 2.7 6.7 3.6 African Americans (AA) 4.8 1.4 0.9 10.8 2.4 0.6 5.0 5.4 6.1 2.9 5.0 2.1 7.5 3.4 13.6 1.4 3.7 3.3 14.8 3.9 (a) Calculate the values of the mean and the median for blood lead level for the sample of African Americans. mean median (b) Which of the mean or the median is larger? What characteristic of the data set explains the relative values of the mean and the median? The median is greater than the mean. This is explained by the fact that the distribution is positively skewed. The mean is greater than the median. This is explained by the fact that the distribution is positively skewed. The median is greater than the mean. This is explained by the fact that the…For a certain experiment, the following values of fracture stress (in megapascals) presented below were measured for a sample of 24 mixtures of hot-mixed asphalt (HMA). Determine the median, the lower quartile, the upper quartile, and the 65th percentile of the measurements.
- A paper gave summary quantities for blood lead level (in micrograms per deciliter) for a sample of whites and a sample of African Americans. Data consistent with the given summary quantities is given below. Whites (W) 8.3 0.9 2.9 5.6 5.8 5.4 1.2 1.0 1.4 2.1 1.3 5.3 8.4 6.6 5.2 3.6 2.9 2.7 6.7 3.8 African Americans (AA) 4.8 1.4 0.9 10.8 2.4 0.6 5.0 5.4 6.1 2.9 5.0 2.1 7.5 3.4 13.4 1.4 3.9 3.3 14.8 4.1 (a) Calculate the values of the mean and the median for blood lead level for the sample of African Americans. meanmedian (b) Which of the mean or the median is larger? What characteristic of the data set explains the relative values of the mean and the median? The mean is greater than the median. This is explained by the fact that the distribution is positively skewed.The median is greater than the mean. This is explained by the fact that the distribution is positively skewed. The median is greater than the mean. This is explained by the fact that the…Serum nitrite concentrations (in μmol/L) were compared between a group of unmedicated HIV+ subjects (n =7) and a control group (n = 10). The HIV+ distribution is strongly skewed.a) Use a Wilcoxon-Mann-Whitney U test to determine if there is convincing evidence at α = 0.05 thatserum nitrite levels differ between the two populations. b) What would have been the U test p-value if researchers had instead hypothesized that serum nitriteconcentrations would tend to be larger in the HIV+ population? HIV+ Control 0.266 0.167 0.269 0.201 0.299 0.205 0.335 0.232 0.503 0.234 0.846 0.260 0.946 0.268 0.288 0.301 0.305Serum nitrite concentrations (in μmol/L) were compared between a group of unmedicated HIV+ subjects (n =7) and a control group (n = 10). The HIV+ distribution is strongly skewed. a) Use a Wilcoxon-Mann-Whitney U test to determine if there is convincing evidence at α = 0.05 thatserum nitrite levels differ between the two populations. b) What would have been the U test p-value if researchers had instead hypothesized that serum nitriteconcentrations would tend to be larger in the HIV+ population?