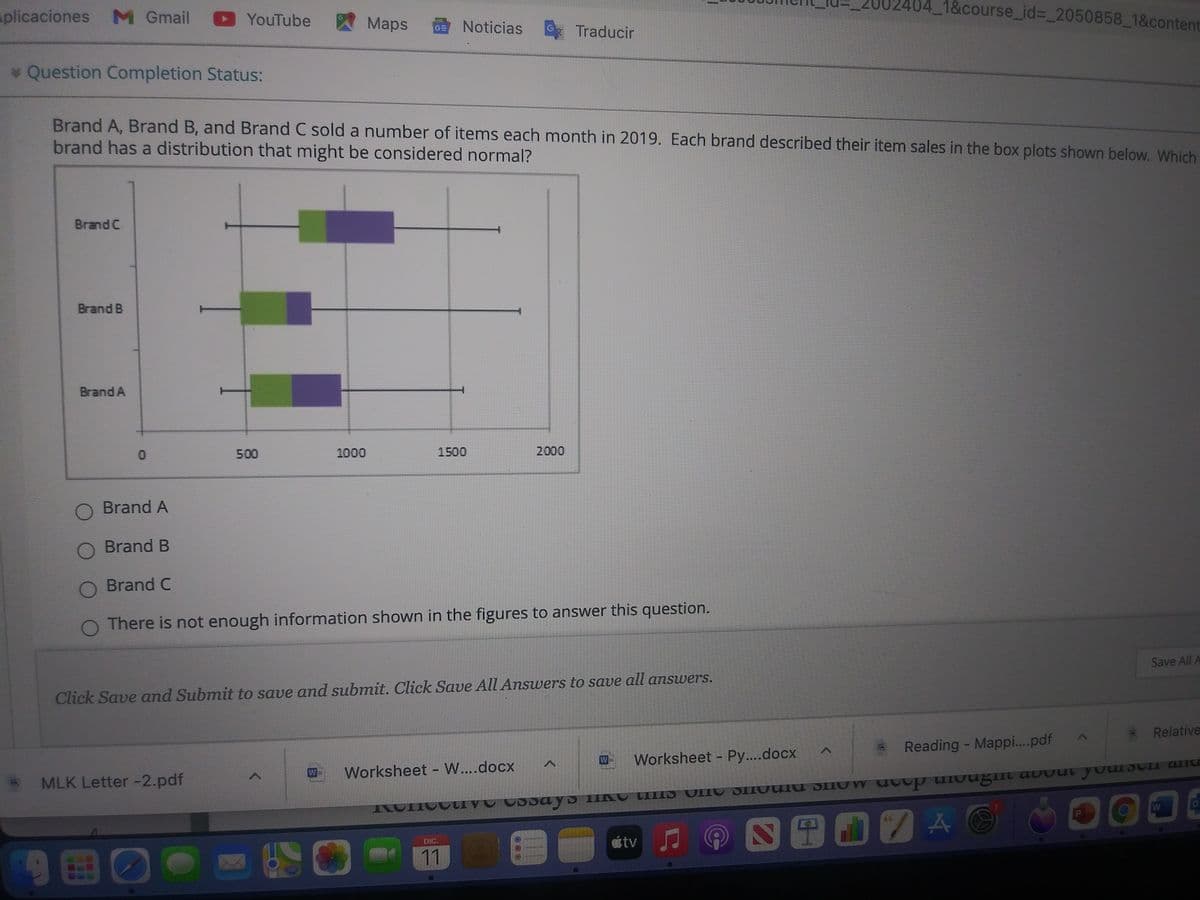
Brand A, Brand B, and Brand C sold a number of items each month in 2019. Each brand described their item sales in the box plots show brand has a distribution that might be considered normal? BrandC Brand B Brand A 500 1000 1500 2000 Brand A Brand B O Brand C O There is not enough information shown in the figures to answer this question. Click Save and Submit to save and submit. Click Save All Answers to save all answers. Reading - Mappi.pdf O O
Q: In marketing children’s products, it is extremely important to produce television commercials that…
A: Excel Procedure: Enter the data for Toys, Food, Children's clothing in Excel sheet. Go to Data…
Q: Wetlands offer a diversity of benefits. They provide a habitat for wildlife, spawning grounds for…
A: Given: 59 83 42 73 50 87 33 38 45 90 27 87 20 35 48 60 38 45 24 42 68 50 35 30 59 9…
Q: Strikingly attractive and good-looking men and women can expect to earn an average of $230,000 more…
A:
Q: A large investment firm on Wall Street wants to review the distribution of ages of its stockbrokers.…
A: Note: Since we only answer up to 3 subparts , we'll answer the first 3. Please resubmit the question…
Q: HOT FOR SALE OR DISTRIBUTION, PROPERTY OF YORK UNIVERSITY Recommended time: 15 minutes a preliminary…
A: We have given that data I want to find null and alternative hypothesis , test statistic and…
Q: Loraine is enrolled in an algebra class that meets 5 days per week. Her instructor gives a test…
A:
Q: The class president collected data on 150 randomly selected 17-year-olds at his school. He surveyed…
A:
Q: _________________ consists of everything or everyone being studied. a. Data b. Sample c. Population…
A: We know that; A Population consists of all subjects processing certain Common characteristics that…
Q: a) Whicn class has a higner medlan sCore? а) З РМ b) 4 PM c) Both classes have the same median…
A: Solution: Where, M=Median Q1= 1st Quartile Q3= 3st Quartile Min=Minimum Max=Maximum
Q: Conclusion Given the body temperatures in the table, what issue can be addressed by conducting a…
A: According to the given table, each column shows a subject for which temperature is recorded at two…
Q: If there is no seasonal effect on human births, we would expect equal numbers of children to be…
A: Given: There are 120 students in the class Winter = 24 Spring = 36 Summer = 32 Fall = 28 Formula…
Q: Loraine is enrolled in an algebra class that meets 5 days per week. Her instructor gives a test…
A: From the provided information, x y 60 72 70 74 80 76 90 78 100…
Q: The Connecticut Mastery Test is administered to 6th graders throughout the state. The Superintendent…
A: From the provided information, Mean (µ) = 270 Standard deviation (σ) = 24 X~N (270, 24) X be a…
Q: Determine whether the data described below are qualitative or quantitative and explain why. The…
A: Quantitative data: Quantitative data measures (or counts) the characteristics of a variable and it…
Q: Background: Morris Saldov conducted a study in Eastern and Central Newfoundland in 1988 to examine…
A: Given data yes No TotalToo little 38…
Q: A. Researchers want to determine if there is a relationship between whether or not a woman smoked…
A:
Q: find the mean, median, and mode of the following set of data. (Enter solutions for mode from…
A: Formula for mean: Formula for median: Mode: Mode is the most frequently appeared observation in…
Q: The box plot shows ages of randomly sampled attendees at two different movies. Movie A Movie B 10 15…
A: From the given diagram: a) Median (A)=22 Median (B)=25 Therefore, Median for Movie B is greater…
Q: Calculate this z test statistic and enter your answer, correct to 3 decimal places, into the box…
A: The z-test is conducted to test significant difference in proportions between two large populations.
Q: Roman, a health data officer, was tasked to create a report describing the height of all the…
A: The given data is, Child Number Sex Height(in cm) 1 Female 144.4 2 Male 152.1 3 Female…
Q: Find the class midpoints and class boundaries. (b) Prepare the relative frequency and percentage…
A: Solution Relative frequency = frequency/N
Q: Select Yes or No to state whether each data set is likely to be normally distributed. Data Set Yes…
A: “Since you have posted a question with multiple sub-parts, we will solve the first three subparts…
Q: In marketing children’s products, it is extremely important to produce television commercials that…
A: e. MINITAB procedure: Choose Stat > ANOVA > One-Way. In Response, enter the column of…
Q: The data represent the age of world leaders on their day of inauguration.48 Find the five-number…
A: Use EXCEL Procedure to obtain the value of first quartile. Follow the instruction to obtain the…
Q: A shopping mall is interested in the income level of its customers and is taking a survey to gather…
A: Correct answer is A sociologist is researching an area i an effort to determine the proportion of…
Q: In marketing children’s products, it is extremely important to produce television commercials that…
A:
Q: Schools and museums: Do people who are interested in environmental issues visit museums more often…
A: Given data: None One More than one Total Very interested 514 137 58 709 Moderately…
Q: 1. Which of the following is data has the most variability for one movie theater on a given day? A.…
A: Variability refers to the variation in the data caused due to different values occurred over time.
Q: All airline passengers must pass through security screenings, but some are subjected to additional…
A: Answer is given below:
Q: Cost-to-charge ratio (the percentage of the amount billed that represents the actual cost) for…
A: Cost to charge ratio is given Regression line is also given, We have to answer for mentioned…
Q: Wetlands offer a diversity of benefits. They provide a habitat for wildlife, spawning grounds for…
A: we will firstly make 2 columns stem and leaf now we will write the tens digit of the number as stem…
Q: A city official would like to know if there is public support for increasing funding for arts…
A: Here the city official is collecting the data by standing the concert hall after a show and surveys…
Q: he price drivers pay for gasoline often varies a great deal across regions throughout the United…
A: Sum of squares for Brand(SSBrand): SSTotal=SSMetropolitan Area+SSBrand+SSError0.149886…
Q: Three sections A, B, and C took the final exam in MATH. Section A with 30 students has a mean score…
A:
Q: In marketing children’s products, it is extremely important to produce television commercials that…
A: Given: Toys/Games Food/Candy Children's Clothing 42 55 30 45 58 35 48 52 42 40 60 32 50…
Q: Determine whether the statement is true or false. If it is false, rewrite it as a true statement.…
A: Solution-: Some quantitative data sets do not have medians. (a) The statement is true (b) The…
Q: The data in MEAPSINGLE were used to estimate the following equations relating school-level…
A: Then the there are two variables which are now explaining the variation in the dependent variable…
Q: Ethan and Drew went on a 10-day fishing trip. The number of smallmouth bass caught and released by…
A: Introduction: Suppose x1, x2, …, xN is a population of size N. The formula for the population mean…
Q: The number of Starbucks coffee shops in cities within 20 miles of theUniversity of California,…
A: a)The dot plot of the data can be drawn using the excel steps as follow:1.Enter the data into excel…
Q: A. Tell whether the following situation is a descriptive statistics or inferential statistics. 1.…
A: 1 This is the Descriptive statistics as it tells the total amount of chairs, cabinets etc for each…
Q: 2. Experiment or observational study ? a. According to insurance records, people who drive red cars…
A: Observational study: In observational study, units in the sample are measured or studied without…
Q: A small coffee shop sells freshly squeezed juices in a refrigerated unit with slots where juice is…
A: The observed proportion of each fruit type can be computed by dividing the number of fruits of a…
Q: overall performance of those centers. One key metric for measuring overall call center performance…
A:
Q: Which among the following is considered as health outcome? DISSATISFACTION DESTITUTION IMPROVED…
A: We have giving the following statement about health outcome.
Q: 6. The table below show data from two police precincts. In which precinct is a violent incident more…
A:
Q: The distribution of hemoglobin in grams per deciliter of blood if approximately N(14,1) in women and…
A: Given the distribution of haemoglobin in grams per deciliter of blood in women is normally…
Q: Roman, a health data officer, was tasked to create a report describing the height of all the…
A: Row Labels Sum of heights f 2764.8 m 2625.9 Grand Total 5390.7
Q: Which data would be suitable for a pie chart? a. Whirlpool corporation's sales revenue for the last…
A: Pie chart is best used for categorical variable.
Trending now
This is a popular solution!
Step by step
Solved in 2 steps with 1 images
- Give three real-world examples of an theoretical distribution of data.A recent experiment included measuring the weight of a package of raw almonds. This type of data would be considered a: Discrete variable or Continuous variable?Do beavers benefit beetles? Researchers laid out 23 circular plots, each 4 meters in diameter, in an area where beavers were cutting down cottonwood trees. In each plot, they counted the number of stumps from trees cut by beavers and the number of clusters of beetle larvae. Ecologists think that the new sprouts from stumps are more tender than other cottonwood growth, so that beetles prefer them. If so, more stumps should produce more beetle larvae. The table contains the data. Stumps Beetle larvae 2 10 2 30 1 12 3 24 3 36 4 40 3 43 1 11 2 27 5 56 1 18 3 40 2 25 1 8 2 21 2 14 1 16 1 6 4 54 1 9 2 13 1 14 4 50 STATE: Choose the statement that best describes the goal of the research. A) Beetle larvae are the explanatory variable, and we expect an increase in beetle larvae to induce an increase in the response variable, the number of tree stumps. B) The number of tree stumps is the explanatory variable, and we expect an increase in…
- When Air Jordan 1 shoes were first released, they were the highest priced sneaker on the market at $70. Price Guide for Air Jordan 1 (various styles) based on Deadstock Men eBay Sales: March 2013 - February 2014 10th Percentile 25th Percentile Median 75th Percentile 90th Percentile $252 $315 $360 $390 $635 a. Plot the data from the table on a number line with $50 increments from $0 - $650. b. Using the same data, plot the points on a number line with $25 increments from $200 - $675 c. Compare and contrast the two figures.Create Distribution Curve (tell if data is skewed or normally dist.)The toco toucan, the largest member of the toucan family, possesses the largest beak relative to body size of all birds. This exaggerated feature has received various interpretations, such as being a refined adaptation for feeding. However, the large surface area may also be an important mechanism for radiating heat (and hence cooling the bird) as outdoor temperature increases. Here are data for beak heat loss, as a percent of total body heat loss from all sources, at various temperatures in degrees Celsius. [Note: The numerical values in this problem have been modified for testing purposes.] Temperature (oC)(oC) 15 16 17 18 19 20 21 22 23 24 25 26 27 28 29 30 Percent heat loss from beak 33 33 34 31 37 46 54 49 41 50 44 56 55 61 64 59 The equation of the least-squares regression line for predicting beak heat loss, as a percent of total body heat loss from all sources, from temperature is: (Use decimal notation. Enter the values of the intercept and slope rounded to two decimal…
- The toco toucan, the largest member of the toucan family, possesses the largest beak relative to body size of all birds. This exaggerated feature has received various interpretations, such as being a refined adaptation for feeding. However, the large surface area may also be an important mechanism for radiating heat (and hence cooling the bird) as outdoor temperature increases. Here are data for beak heat loss, as a percent of total body heat loss from all sources, at various temperatures in degrees Celsius. [Note: The numerical values in this problem have been modified for testing purposes.] Temperature (oC)(oC) 15 16 17 18 19 20 21 22 23 24 25 26 27 28 29 30 Percent heat loss from beak 34 32 33 29 38 46 58 50 46 53 44 51 57 58 59 58 The equation of the least-squares regression line for predicting beak heat loss, as a percent of total body heat loss from all sources, from temperature is: (Use decimal notation. Enter the values of the intercept and slope rounded to two…The toco toucan, the largest member of the toucan family, possesses the largest beak relative to body size of all birds. This exaggerated feature has received various interpretations, such as being a refined adaptation for feeding. However, the large surface area may also be an important mechanism for radiating heat (and hence cooling the bird) as outdoor temperature increases. Here are data for beak heat loss, as a percent of total body heat loss from all sources, at various temperatures in degrees Celsius. [Note: The numerical values in this problem have been modified for testing purposes.] Temperature (oC)(oC) 15 16 17 18 19 20 21 22 23 24 25 26 27 28 29 30 Percent heat loss from beak 33 32 33 32 39 43 56 48 44 49 44 56 58 60 60 63 The equation of the least-squares regression line for predicting beak heat loss, as a percent of total body heat loss from all sources, from temperature is: (Use decimal notation. Enter the values of the intercept and slope rounded to two…The dataset below was collected from a survey to determine whether CFT development in the island can be used as a strategy for the sustainable management and utilization of the fishery and aquatic resources in small islands. It shows the monthly income (in thousand pesos) estimated by 200 randomly selected fishers in Guimaras according to the type of fishers (i.e., the income source of fishers is solely fishing or they have alternative/supplemental livelihood such as island hopping services, sari-sari store ownership, fish value adding and/or vending, souvenir selling, carpentry, as construction worker, farming and tour guiding) and their perceived benefit from CFT development in the island. From this dataset and using = 0.05, is there a significant difference in estimated monthly income due tofisher type? How about due to the CFT perceived benefit? How about due to the interaction between fishertype and the perceived CFT benefit?a. Analyze manually and assume that the…