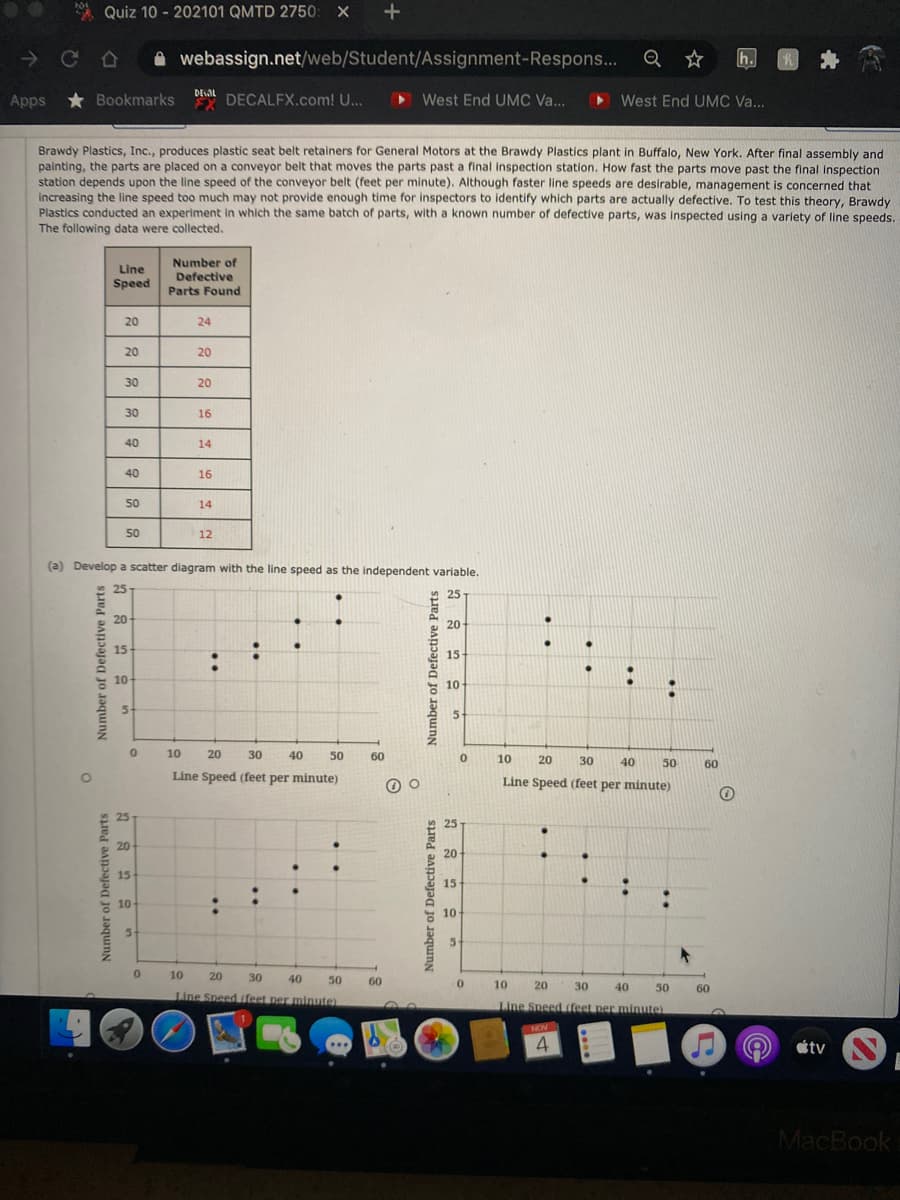
Brawdy Plastics, Inc., produces plastic seat belt retainers for General Motors at the Brawdy Plastics plant in Buffalo, New York. After final assembly and painting, the parts are placed on a conveyor belt that moves the parts past a final inspection station. How fast the parts move past the final inspection station depends upon the line speed of the conveyor belt (feet per minute). Although faster line speeds are desirable, management is concerned that increasing the line speed too much may not provide enough time for inspectors to identify which parts are actually defective. To test this theory, Brawdy Plastics conducted an experiment in which the same batch of parts, with a known number of defective parts, was inspected using a variety of line speeds. The following data were collected. Number of Line Defective Speed Parts Found 20 24 20 20 30 20 30 16 40 14 40 16 50 14 50 12 (a) Develop a scatter diagram with the line speed as the independent variable. 25 25 20 20 15 15- 10 : 10 5. 5. 10 20 30 40 50 60 10 20 30 40 50 60 Line Speed (feet per minute) Line Speed (feet per minute) 20 20 15 15 10 10 10 20 30 40 50 60 10 20 30 40 50 60 Line Speed (feet per minute) Line Speed (feet ner mini Number of Defective Parts Number of Defective Parts in Number of Defective Parts Number of Defective Parts in
Brawdy Plastics, Inc., produces plastic seat belt retainers for General Motors at the Brawdy Plastics plant in Buffalo, New York. After final assembly and painting, the parts are placed on a conveyor belt that moves the parts past a final inspection station. How fast the parts move past the final inspection station depends upon the line speed of the conveyor belt (feet per minute). Although faster line speeds are desirable, management is concerned that increasing the line speed too much may not provide enough time for inspectors to identify which parts are actually defective. To test this theory, Brawdy Plastics conducted an experiment in which the same batch of parts, with a known number of defective parts, was inspected using a variety of line speeds. The following data were collected. Number of Line Defective Speed Parts Found 20 24 20 20 30 20 30 16 40 14 40 16 50 14 50 12 (a) Develop a scatter diagram with the line speed as the independent variable. 25 25 20 20 15 15- 10 : 10 5. 5. 10 20 30 40 50 60 10 20 30 40 50 60 Line Speed (feet per minute) Line Speed (feet per minute) 20 20 15 15 10 10 10 20 30 40 50 60 10 20 30 40 50 60 Line Speed (feet per minute) Line Speed (feet ner mini Number of Defective Parts Number of Defective Parts in Number of Defective Parts Number of Defective Parts in

Algebra & Trigonometry with Analytic Geometry
13th Edition
ISBN:9781133382119
Author:Swokowski
Publisher:Swokowski
Chapter10: Sequences, Series, And Probability
Section10.8: Probability
Problem 60E

Related questions
Question
Transcribed Image Text:A Quiz 10 - 202101 QMTD 2750: X +
A webassign.net/web/Student/Assignment-Respons... Q ☆
h.
Apps
* Bookmarks oait DECALFX.com! U...
West End UMC Va...
> West End UMC Va...
Brawdy Plastics, Inc., produces plastic seat belt retainers for General Motors at the Brawdy Plastics plant in Buffalo, New York. After final assembly and
painting, the parts are placed on a conveyor belt that moves the parts past a final inspection station. How fast the parts move past the final Inspection
station depends upon the line speed of the conveyor belt (feet per minute). Although faster line speeds are desirable, management is concerned that
increasing the line speed too much may not provide enough time for inspectors to identify which parts are actually defective. To test this theory, Brawdy
Plastics conducted an experiment in which the same batch of parts, with a known number of defective parts, was inspected using a varlety of line speeds.
The following data were collected.
Number of
Line
Defective
Speed
Parts Found
20
24
20
20
30
20
30
16
40
14
40
16
50
14
50
12
(a) Develop a scatter diagram with the line speed as the independent variable.
25
25
20
20
15-
15
10
10
10
20
30
40
50
60
10
20
30
40
50
60
Line Speed (feet per minute)
Line Speed (feet per minute)
25
25
20
20
15
15
10
10
5-
10
20
30
40
50
60
10
20
30
40
50
60
Line Speed ifeet per minute)
Line Speed (feet per minute)
NOV
étv
MacBook
Number of Defective Parts
Number of Defective Parts
Number of Defective Parts
Number of Defective Parts
Transcribed Image Text:-Respons...
Q ☆
* Bookmarks
DELAL
pps
EX DECALFX.com! U..
West End UMC Va...
West End UMC Va...
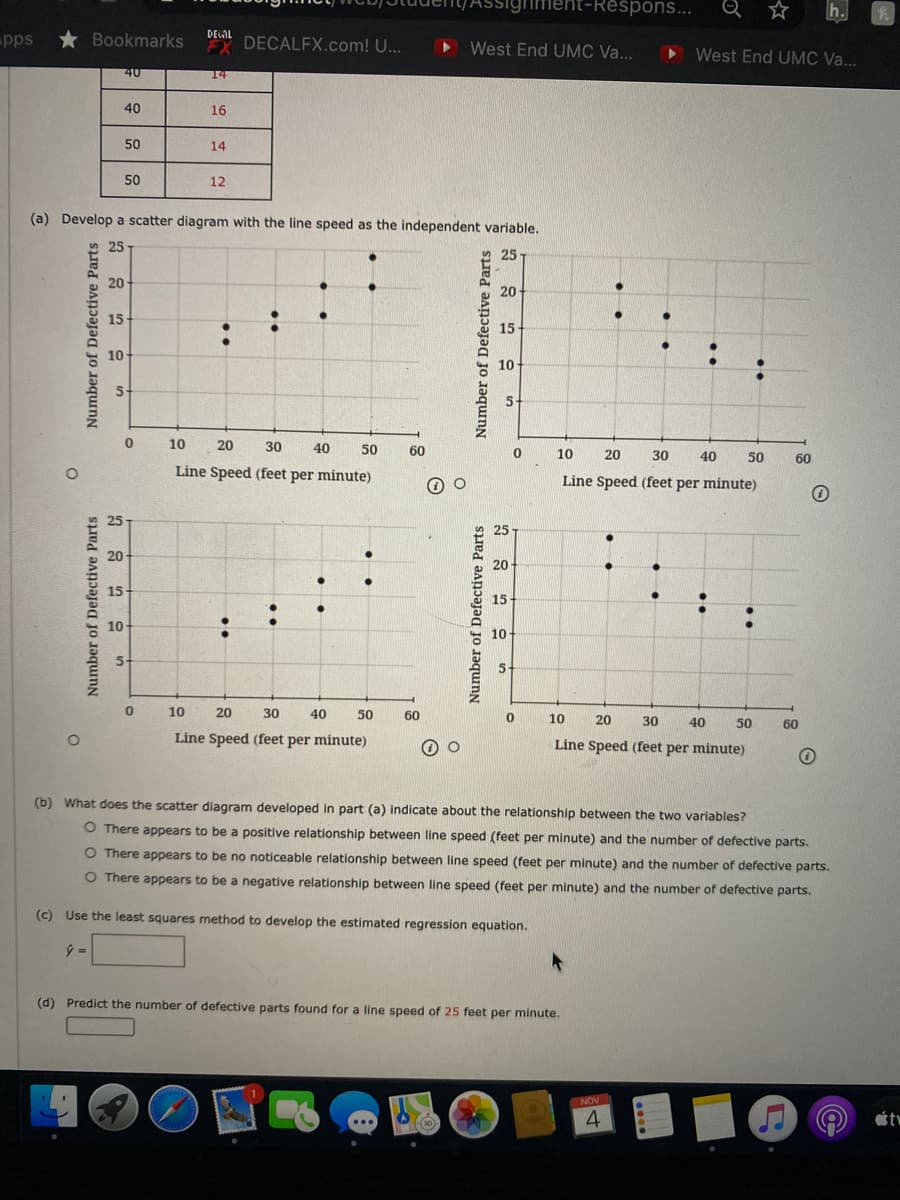
40
14
40
16
50
14
50
12
(a) Develop a scatter diagram with the line speed as the independent variable.
25
25
20
20
15
:
15
10
10
10
20
30
40
50
60
10
20
30
40
50
60
Line Speed (feet per minute)
Line Speed (feet per minute)
25
25
20
20
15
15
10
10
10
20
30
40
50
60
10
20
30
40
50
60
Line Speed (feet per minute)
Line Speed (feet per minute)
(b) What does the scatter diagram developed in part (a) indicate about the relationship between the two variables?
O There appears to be a positive relationship between line speed (feet per minute) and the number of defective parts.
O There appears to be no noticeable relationship between line speed (feet per minute) and the number of defective parts.
O There appears to be a negative relationship between line speed (feet per minute) and the number of defective parts.
(c) Use the least squares method to develop the estimated regression equation.
(d) Predict the number of defective parts found for a line speed of 25 feet per minute.
NOV
tw
Number of Defective Parts
Number of Defective Parts
Number of Defective Parts
Number of Defective Parts
Expert Solution
This question has been solved!
Explore an expertly crafted, step-by-step solution for a thorough understanding of key concepts.

This is a popular solution!

Trending now
This is a popular solution!

Step by step
Solved in 5 steps with 3 images

Knowledge Booster


Learn more about
Need a deep-dive on the concept behind this application? Look no further. Learn more about this topic, statistics and related others by exploring similar questions and additional content below.Recommended textbooks for you
Algebra & Trigonometry with Analytic Geometry
Algebra
ISBN:
9781133382119
Author:
Swokowski
Publisher:
Cengage
Algebra & Trigonometry with Analytic Geometry
Algebra
ISBN:
9781133382119
Author:
Swokowski
Publisher:
Cengage