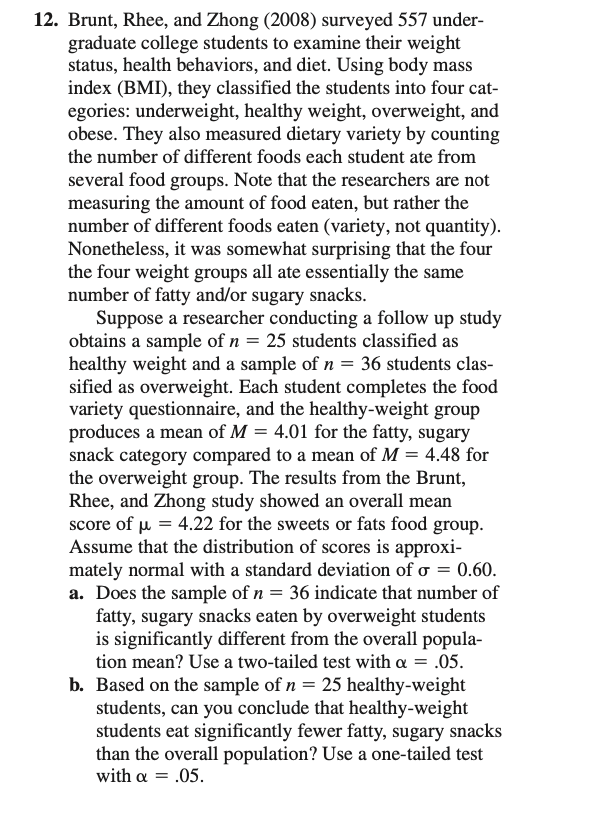
Brunt, Rhee, and Zhong (2008) surveyed 557 under- graduate college students to examine their weight status, health behaviors, and diet. Using body mass index (BMI), they classified the students into four cat- egories: underweight, healthy weight, overweight, and obese. They also measured dietary variety by counting the number of different foods each student ate from several food groups. Note that the researchers are not measuring the amount of food eaten, but rather the number of different foods eaten (variety, not quantity). Nonetheless, it was somewhat surprising that the four the four weight groups all ate essentially the same number of fatty and/or sugary snacks. Suppose a researcher conducting a follow up study obtains a sample of n = 25 students classified as healthy weight and a sample of n = 36 students clas- sified as overweight. Each student completes the food variety questionnaire, and the healthy-weight group produces a mean of M = 4.01 for the fatty, sugary snack category compared to a mean of M = 4.48 for the overweight group. The results from the Brunt, Rhee, and Zhong study showed an overall mean score of pu = 4.22 for the sweets or fats food group. Assume that the distribution of scores is approxi- mately normal with a standard deviation of o = 0.60. a. Does the sample of n = 36 indicate that number of fatty, sugary snacks eaten by overweight students is significantly different from the overall popula- tion mean? Use a two-tailed test with a = .05. b. Based on the sample of n = 25 healthy-weight students, can you conclude that healthy-weight students eat significantly fewer fatty, sugary snacks than the overall population? Use a one-tailed test with a = .05.
Brunt, Rhee, and Zhong (2008) surveyed 557 under- graduate college students to examine their weight status, health behaviors, and diet. Using body mass index (BMI), they classified the students into four cat- egories: underweight, healthy weight, overweight, and obese. They also measured dietary variety by counting the number of different foods each student ate from several food groups. Note that the researchers are not measuring the amount of food eaten, but rather the number of different foods eaten (variety, not quantity). Nonetheless, it was somewhat surprising that the four the four weight groups all ate essentially the same number of fatty and/or sugary snacks. Suppose a researcher conducting a follow up study obtains a sample of n = 25 students classified as healthy weight and a sample of n = 36 students clas- sified as overweight. Each student completes the food variety questionnaire, and the healthy-weight group produces a mean of M = 4.01 for the fatty, sugary snack category compared to a mean of M = 4.48 for the overweight group. The results from the Brunt, Rhee, and Zhong study showed an overall mean score of pu = 4.22 for the sweets or fats food group. Assume that the distribution of scores is approxi- mately normal with a standard deviation of o = 0.60. a. Does the sample of n = 36 indicate that number of fatty, sugary snacks eaten by overweight students is significantly different from the overall popula- tion mean? Use a two-tailed test with a = .05. b. Based on the sample of n = 25 healthy-weight students, can you conclude that healthy-weight students eat significantly fewer fatty, sugary snacks than the overall population? Use a one-tailed test with a = .05.

Glencoe Algebra 1, Student Edition, 9780079039897, 0079039898, 2018
18th Edition
ISBN:9780079039897
Author:Carter
Publisher:Carter
Chapter10: Statistics
Section10.6: Summarizing Categorical Data
Problem 25PPS

Related questions
Topic Video
Question
Transcribed Image Text:12. Brunt, Rhee, and Zhong (2008) surveyed 557 under-
graduate college students to examine their weight
status, health behaviors, and diet. Using body mass
index (BMI), they classified the students into four cat-
egories: underweight, healthy weight, overweight, and
obese. They also measured dietary variety by counting
the number of different foods each student ate from
several food groups. Note that the researchers are not
measuring the amount of food eaten, but rather the
number of different foods eaten (variety, not quantity).
Nonetheless, it was somewhat surprising that the four
the four weight groups all ate essentially the same
number of fatty and/or sugary snacks.
Suppose a researcher conducting a follow up study
obtains a sample of n = 25 students classified as
healthy weight and a sample of n = 36 students clas-
sified as overweight. Each student completes the food
variety questionnaire, and the healthy-weight group
produces a mean of M = 4.01 for the fatty, sugary
snack category compared to a mean of M = 4.48 for
the overweight group. The results from the Brunt,
Rhee, and Zhong study showed an overall mean
score of µ = 4.22 for the sweets or fats food group.
Assume that the distribution of scores is approxi-
mately normal with a standard deviation of o = 0.60.
a. Does the sample of n = 36 indicate that number of
fatty, sugary snacks eaten by overweight students
is significantly different from the overall popula-
tion mean? Use a two-tailed test with a = .05.
b. Based on the sample of n = 25 healthy-weight
students, can you conclude that healthy-weight
students eat significantly fewer fatty, sugary snacks
than the overall population? Use a one-tailed test
with a = .05.
Expert Solution
This question has been solved!
Explore an expertly crafted, step-by-step solution for a thorough understanding of key concepts.

Step by step
Solved in 2 steps with 2 images

Knowledge Booster


Learn more about
Need a deep-dive on the concept behind this application? Look no further. Learn more about this topic, statistics and related others by exploring similar questions and additional content below.Recommended textbooks for you
Glencoe Algebra 1, Student Edition, 9780079039897…
Algebra
ISBN:
9780079039897
Author:
Carter
Publisher:
McGraw Hill

Big Ideas Math A Bridge To Success Algebra 1: Stu…
Algebra
ISBN:
9781680331141
Author:
HOUGHTON MIFFLIN HARCOURT
Publisher:
Houghton Mifflin Harcourt

Holt Mcdougal Larson Pre-algebra: Student Edition…
Algebra
ISBN:
9780547587776
Author:
HOLT MCDOUGAL
Publisher:
HOLT MCDOUGAL
Glencoe Algebra 1, Student Edition, 9780079039897…
Algebra
ISBN:
9780079039897
Author:
Carter
Publisher:
McGraw Hill
Big Ideas Math A Bridge To Success Algebra 1: Stu…
Algebra
ISBN:
9781680331141
Author:
HOUGHTON MIFFLIN HARCOURT
Publisher:
Houghton Mifflin Harcourt
Holt Mcdougal Larson Pre-algebra: Student Edition…
Algebra
ISBN:
9780547587776
Author:
HOLT MCDOUGAL
Publisher:
HOLT MCDOUGAL