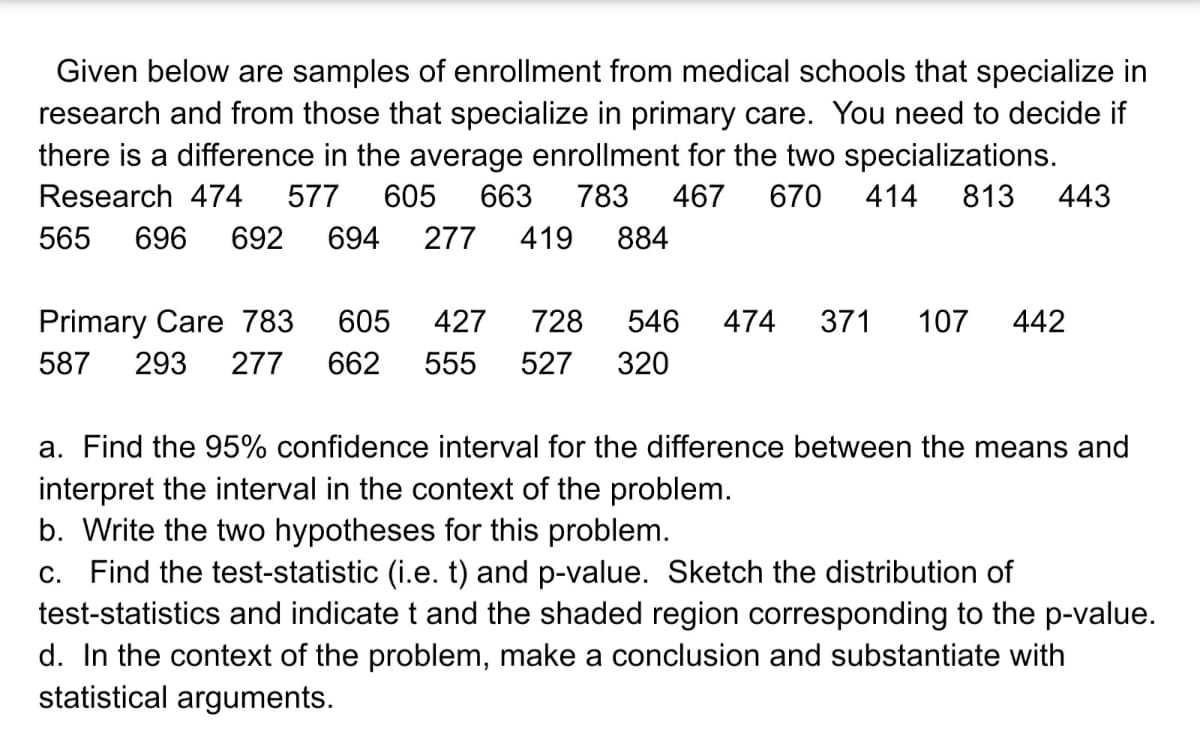
Given below are samples of enrollment from medical schools that specialize in research and from those that specialize in primary care. You need to decide if there is a difference in the average enrollment for the two specializations. Research 474 577 605 663 783 467 670 414 813 443 565 696 692 694 277 419 884 Primary Care 783 605 427 728 546 474 371 107 442 587 293 277 662 555 527 320
Given below are samples of enrollment from medical schools that specialize in research and from those that specialize in primary care. You need to decide if there is a difference in the average enrollment for the two specializations. Research 474 577 605 663 783 467 670 414 813 443 565 696 692 694 277 419 884 Primary Care 783 605 427 728 546 474 371 107 442 587 293 277 662 555 527 320

Functions and Change: A Modeling Approach to College Algebra (MindTap Course List)
6th Edition
ISBN:9781337111348
Author:Bruce Crauder, Benny Evans, Alan Noell
Publisher:Bruce Crauder, Benny Evans, Alan Noell
Chapter5: A Survey Of Other Common Functions
Section5.3: Modeling Data With Power Functions
Problem 6E: Urban Travel Times Population of cities and driving times are related, as shown in the accompanying...

Related questions
Topic Video
Question
100%
Transcribed Image Text:Given below are samples of enrollment from medical schools that specialize in
research and from those that specialize in primary care. You need to decide if
there is a difference in the average enrollment for the two specializations.
Research 474
577
605
663
783
467
670
414
813
443
565 696 692
694 277
419
884
Primary Care 783
605
427
728
546
474
371
107
442
587
293
277
662
555
527
320
a. Find the 95% confidence interval for the difference between the means and
interpret the interval in the context of the problem.
b. Write the two hypotheses for this problem.
c. Find the test-statistic (i.e. t) and p-value. Sketch the distribution of
test-statistics and indicate t and the shaded region corresponding to the p-value.
d. In the context of the problem, make a conclusion and substantiate with
statistical arguments.
Expert Solution
This question has been solved!
Explore an expertly crafted, step-by-step solution for a thorough understanding of key concepts.

This is a popular solution!

Trending now
This is a popular solution!

Step by step
Solved in 2 steps with 3 images

Knowledge Booster


Learn more about
Need a deep-dive on the concept behind this application? Look no further. Learn more about this topic, statistics and related others by exploring similar questions and additional content below.Recommended textbooks for you
Functions and Change: A Modeling Approach to Coll…
Algebra
ISBN:
9781337111348
Author:
Bruce Crauder, Benny Evans, Alan Noell
Publisher:
Cengage Learning

Glencoe Algebra 1, Student Edition, 9780079039897…
Algebra
ISBN:
9780079039897
Author:
Carter
Publisher:
McGraw Hill
Functions and Change: A Modeling Approach to Coll…
Algebra
ISBN:
9781337111348
Author:
Bruce Crauder, Benny Evans, Alan Noell
Publisher:
Cengage Learning
Glencoe Algebra 1, Student Edition, 9780079039897…
Algebra
ISBN:
9780079039897
Author:
Carter
Publisher:
McGraw Hill