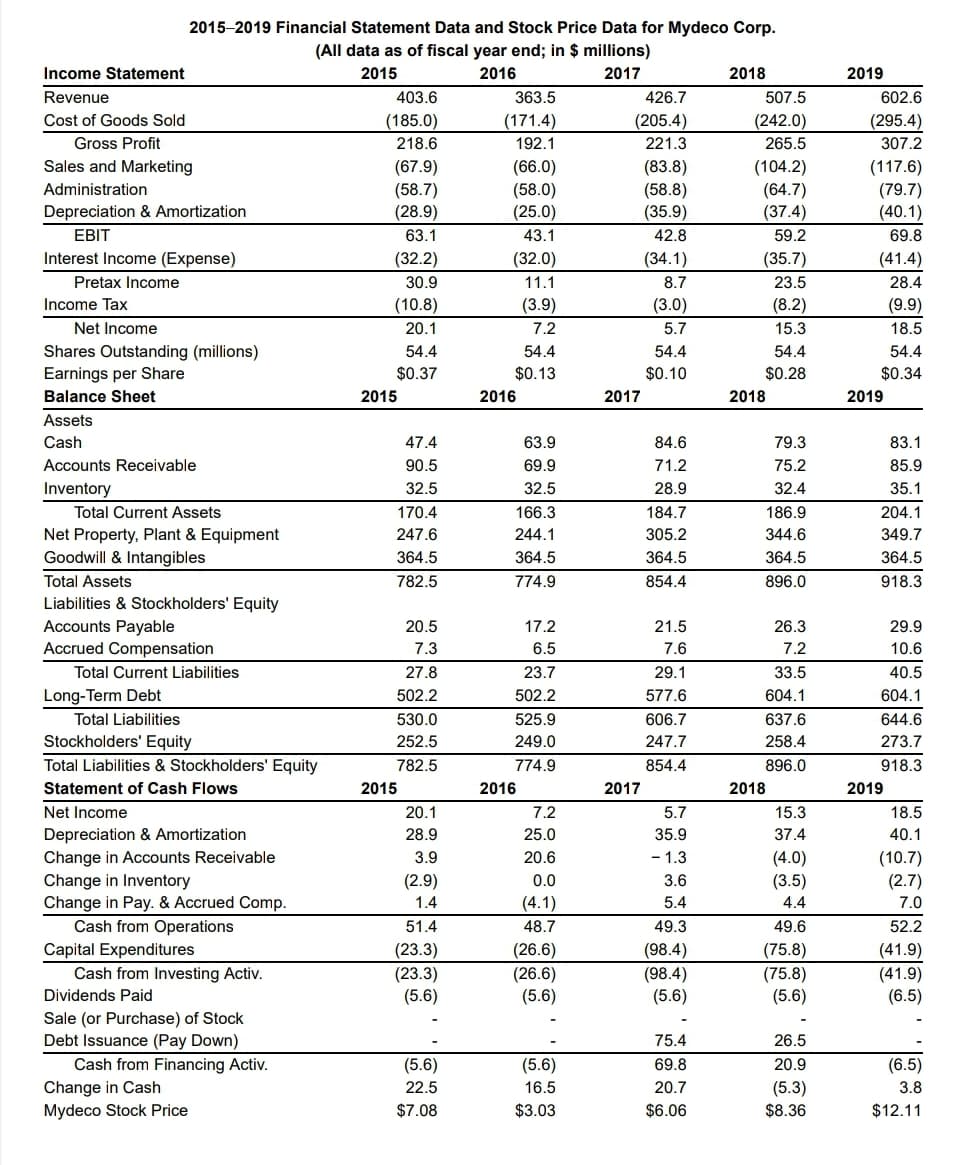
By what percentage did​ Mydeco's revenues grow each year from 2016 to 2019​? (Round to two decimal​places.) By what percentage did net income grow each​ year? (Round to two decimal​places.) Why might the growth rates of revenues and net income​ differ?

Financial Accounting
14th Edition
ISBN:9781305088436
Author:Carl Warren, Jim Reeve, Jonathan Duchac
Publisher:Carl Warren, Jim Reeve, Jonathan Duchac
Chapter6: Accounting For Merchandising Businesses
Section: Chapter Questions
Problem 7PEA: Financial statement data for years ending December 31 for Latchkey Company follows: a. Determine the...
icon
Related questions
icon
Concept explainers
Topic Video
Question
100%
  1. By what percentage did​ Mydeco's revenues grow each year from 2016 to 2019​? (Round to two decimal​places.)
  2. By what percentage did net income grow each​ year? (Round to two decimal​places.)
  3. Why might the growth rates of revenues and net income​ differ?
2015-2019 Financial Statement Data and Stock Price Data for Mydeco Corp.
(All data as of fiscal year end; in $ millions)
Income Statement
2015
2016
2017
2018
2019
Revenue
403.6
363.5
426.7
507.5
602.6
Cost of Goods Sold
(185.0)
(205.4)
(242.0)
(171.4)
192.1
(295.4)
307.2
Gross Profit
218.6
221.3
265.5
Sales and Marketing
(67.9)
(58.7)
(28.9)
(66.0)
(58.0)
(25.0)
(83.8)
(58.8)
(35.9)
(104.2)
(64.7)
(37.4)
(117.6)
(79.7)
(40.1)
Administration
Depreciation & Amortization
EBIT
63.1
43.1
42.8
59.2
69.8
Interest Income (Expense)
(32.2)
(32.0)
(34.1)
(35.7)
(41.4)
Pretax Income
30.9
11.1
8.7
23.5
28.4
Income Tax
(10.8)
(3.9)
(3.0)
(8.2)
(9.9)
Net Income
20.1
7.2
5.7
15.3
18.5
Shares Outstanding (millions)
Earnings per Share
54.4
54.4
54.4
54.4
54.4
$0.37
$0.13
$0.10
$0.28
$0.34
Balance Sheet
2015
2016
2017
2018
2019
Assets
Cash
47.4
63.9
84.6
79.3
83.1
Accounts Receivable
90.5
69.9
71.2
75.2
85.9
Inventory
32.5
32.5
28.9
32.4
35.1
Total Current Assets
170.4
166.3
184.7
186.9
204.1
Net Property, Plant & Equipment
Goodwill & Intangibles
247.6
244.1
305.2
344.6
349.7
364.5
364.5
364.5
364.5
364.5
Total Assets
782.5
774.9
854.4
896.0
918.3
Liabilities & Stockholders' Equity
Accounts Payable
Accrued Compensation
20.5
17.2
21.5
26.3
29.9
7.3
6.5
7.6
7.2
10.6
Total Current Liabilities
27.8
23.7
29.1
33.5
40.5
Long-Term Debt
502.2
502.2
577.6
604.1
604.1
Total Liabilities
530.0
525.9
606.7
637.6
644.6
Stockholders' Equity
252.5
249.0
247.7
258.4
273.7
Total Liabilities & Stockholders' Equity
782.5
774.9
854.4
896.0
918.3
Statement of Cash Flows
2015
2016
2017
2018
2019
Net Income
20.1
7.2
5.7
15.3
18.5
Depreciation & Amortization
Change in Accounts Receivable
Change in Inventory
Change in Pay. & Accrued Comp.
Cash from Operations
28.9
25.0
35.9
37.4
40.1
3.9
20.6
- 1.3
(4.0)
(3.5)
(10.7)
(2.7)
(2.9)
0.0
3.6
1.4
(4.1)
5.4
4.4
7.0
51.4
48.7
49.3
49.6
52.2
(98.4)
(98.4)
(5.6)
Capital Expenditures
(23.3)
(23.3)
(5.6)
(26.6)
(26.6)
(5.6)
(75.8)
(75.8)
(5.6)
(41.9)
Cash from Investing Activ.
(41.9)
(6.5)
Dividends Paid
Sale (or Purchase) of Stock
Debt Issuance (Pay Down)
-
75.4
26.5
Cash from Financing Activ.
(5.6)
(5.6)
69.8
20.9
(6.5)
Change in Cash
Mydeco Stock Price
22.5
16.5
20.7
(5.3)
$8.36
3.8
$7.08
$3.03
$6.06
$12.11
Transcribed Image Text:2015-2019 Financial Statement Data and Stock Price Data for Mydeco Corp. (All data as of fiscal year end; in $ millions) Income Statement 2015 2016 2017 2018 2019 Revenue 403.6 363.5 426.7 507.5 602.6 Cost of Goods Sold (185.0) (205.4) (242.0) (171.4) 192.1 (295.4) 307.2 Gross Profit 218.6 221.3 265.5 Sales and Marketing (67.9) (58.7) (28.9) (66.0) (58.0) (25.0) (83.8) (58.8) (35.9) (104.2) (64.7) (37.4) (117.6) (79.7) (40.1) Administration Depreciation & Amortization EBIT 63.1 43.1 42.8 59.2 69.8 Interest Income (Expense) (32.2) (32.0) (34.1) (35.7) (41.4) Pretax Income 30.9 11.1 8.7 23.5 28.4 Income Tax (10.8) (3.9) (3.0) (8.2) (9.9) Net Income 20.1 7.2 5.7 15.3 18.5 Shares Outstanding (millions) Earnings per Share 54.4 54.4 54.4 54.4 54.4 $0.37 $0.13 $0.10 $0.28 $0.34 Balance Sheet 2015 2016 2017 2018 2019 Assets Cash 47.4 63.9 84.6 79.3 83.1 Accounts Receivable 90.5 69.9 71.2 75.2 85.9 Inventory 32.5 32.5 28.9 32.4 35.1 Total Current Assets 170.4 166.3 184.7 186.9 204.1 Net Property, Plant & Equipment Goodwill & Intangibles 247.6 244.1 305.2 344.6 349.7 364.5 364.5 364.5 364.5 364.5 Total Assets 782.5 774.9 854.4 896.0 918.3 Liabilities & Stockholders' Equity Accounts Payable Accrued Compensation 20.5 17.2 21.5 26.3 29.9 7.3 6.5 7.6 7.2 10.6 Total Current Liabilities 27.8 23.7 29.1 33.5 40.5 Long-Term Debt 502.2 502.2 577.6 604.1 604.1 Total Liabilities 530.0 525.9 606.7 637.6 644.6 Stockholders' Equity 252.5 249.0 247.7 258.4 273.7 Total Liabilities & Stockholders' Equity 782.5 774.9 854.4 896.0 918.3 Statement of Cash Flows 2015 2016 2017 2018 2019 Net Income 20.1 7.2 5.7 15.3 18.5 Depreciation & Amortization Change in Accounts Receivable Change in Inventory Change in Pay. & Accrued Comp. Cash from Operations 28.9 25.0 35.9 37.4 40.1 3.9 20.6 - 1.3 (4.0) (3.5) (10.7) (2.7) (2.9) 0.0 3.6 1.4 (4.1) 5.4 4.4 7.0 51.4 48.7 49.3 49.6 52.2 (98.4) (98.4) (5.6) Capital Expenditures (23.3) (23.3) (5.6) (26.6) (26.6) (5.6) (75.8) (75.8) (5.6) (41.9) Cash from Investing Activ. (41.9) (6.5) Dividends Paid Sale (or Purchase) of Stock Debt Issuance (Pay Down) - 75.4 26.5 Cash from Financing Activ. (5.6) (5.6) 69.8 20.9 (6.5) Change in Cash Mydeco Stock Price 22.5 16.5 20.7 (5.3) $8.36 3.8 $7.08 $3.03 $6.06 $12.11
Expert Solution
trending now

Trending now

This is a popular solution!

steps

Step by step

Solved in 2 steps with 1 images

Blurred answer
Knowledge Booster
Stock Valuation
Learn more about
Need a deep-dive on the concept behind this application? Look no further. Learn more about this topic, finance and related others by exploring similar questions and additional content below.
Similar questions
  • SEE MORE QUESTIONS
Recommended textbooks for you
Financial Accounting
Accounting
ISBN:
9781305088436
Author:
Carl Warren, Jim Reeve, Jonathan Duchac
Publisher:
Cengage Learning
Cornerstones of Financial Accounting
Accounting
ISBN:
9781337690881
Author:
Jay Rich, Jeff Jones
Publisher:
Cengage Learning
Survey of Accounting (Accounting I)
Accounting
ISBN:
9781305961883
Author:
Carl Warren
Publisher:
Cengage Learning
Financial & Managerial Accounting
Accounting
ISBN:
9781285866307
Author:
Carl Warren, James M. Reeve, Jonathan Duchac
Publisher:
Cengage Learning
Financial Accounting
Accounting
ISBN:
9781337272124
Author:
Carl Warren, James M. Reeve, Jonathan Duchac
Publisher:
Cengage Learning
Fundamentals of Financial Management (MindTap Cou…
Finance
ISBN:
9781337395250
Author:
Eugene F. Brigham, Joel F. Houston
Publisher:
Cengage Learning