(c) Calculate P(3.5 ≤ x ≤ 4.5). 0.5 Calculate P(4.5 < X). 0.2781
Q: 74567 If the joint 2022/01/the random variable(X,Y) is given by ((x+3xy²) 0<x<2,0 <y <1 {+ (x 0…
A:
Q: C. How many 4-digits number can be formed out of 0, 1, 2, 4, 6, 8, 9 to construct an odd number with…
A:
Q: nother measure of central tendency is the trimmed mean. It is computed by determining the mean of a…
A: Given data set : From Given data set we will trim smallest and largest values of data set .
Q: variance Xt, var(Xt). Do they depend on t? ii. Determine the covariance of xt and xt+h for h > 0,…
A:
Q: The probability that data are entered incorrectly into a field in a database is 0.005. A data entry…
A: Hint: Uniform distribution has equal probability all over the given interval. Obtain the…
Q: Q3. (a) Construct a 98% Confidence Interval based on the following data: 45, 55, 67, 45, 68, 79, 98,…
A: The question is about confidence interval Given : No. of foot surgery patients ( n ) = 10 Sample…
Q: e 2. C 5 7 B 9 10 Home Cut Copy Format Painter Clipboard 1 Week 1 C20 A 2 3 4 5 6 7 8 9 10 Total…
A: Provided data: Week No. of Commercials Sales Volume 1 2 50 2 5 57 3 1 41 4 3 54 5 4 54…
Q: Here is a sample data set (n = 48) that is nearly normal (as can be seen in the histogram provided…
A: Given: n = 48 Formula Used: If the data point falls outside the limit, the data point is considered…
Q: A new lecturer has been hired to teach an undergraduate course in psychological research methods.…
A: The following information has been given: x¯1=75 x¯2=79s1=5…
Q: If the range of X is the set (0,1,2,3,4,5,6,7,8) and P(X= x) is defined in the following table: 0 1…
A:
Q: To study the effect of temperature on yield in a chemical process, five batches were produced at…
A: Given data: Temperature 50oC 60oC 70oC 35 29 24 23 31 27 35 35 27 38 23 29 34 22…
Q: 5 Consider the Markov chain with transition matrix (1/4-3/4) Find the fundamental matrix Z for this…
A:
Q: The following information was obtained from matched samples taken from two populations. Assume the…
A: From the provided information, Sample size (n) = 5 The point estimate of the difference between the…
Q: Assume that when a student is asked the question “do you support Proposition G”, he or she is…
A: Solution
Q: The mean entry level salary of an employee at a company is $60,000. You believe it is lower for IT…
A: First we will define the null and alternative hypothesis We define null and alternative…
Q: This figure presents the percentage deviat from the 60:40 ratio in the market values o equity of…
A: Hint: The graph has an increasing trend over the period of time.
Q: . The ungrouped data below shows the different temperatures measured during n experiment. Construct…
A: The objective is to construct a frequency table for the ungrouped data and calculate its mean,…
Q: Which of these is not an assumption of the z test? a. The dependent variable is measured on a scale…
A: Followings are the Explanation of the question Z - test:- When the Population standard deviation…
Q: if n = 60,272,5=10, For testing Select one a Z=-2.32 OD Z-2.32 1 232 d. 1-2.32 H₂=75 vs H: >75, the…
A: given data n = 60 x¯ = 72 s= 10 Ho: μ = 75 Ha: μ>75 test statistic = ?
Q: find k? |X=xi P(X=xi) 1 4k 2 k 3 2k 4 3k
A: It is given that the probability distribution of random variable X with values 1, 2, 3 and 4.
Q: Construct an ungrouped frequency distribution for the data.
A: It is given that Number of observations n = 30 Data arranged in ascending order : 2, 2, 3, 3, 3, 3,…
Q: Q1. A restaurant owner is interested in the proportion of his customers who order dessert. He looks…
A: “Since you have asked multiple questions, we will solve the first question for you. If you want any…
Q: cores in the first and fourth (final) rounds for a sample of 20 golfers who competed in golf…
A: Given: Sample size n = 20 α = 0.10 Formula Used: Test-statistic t = dsdn Margin of error = tsdn
Q: For observation study, determine whether cross-sectional, retrospective, or prospective is used.…
A: There are types of study, some of them are cross sectional, retrospective or prospective.…
Q: A set of data item is normally distributed with a mean 218 and a standard deviation of 49. Find the…
A:
Q: 5. An English Christmas carol entitled "The Twelve Days of Christmas" enumerates a series of…
A:
Q: If the probability that a company will win a contract is 0.3, what is the probability that it will…
A: Given that The probability that a company will win a contract = P(A) = 0.3
Q: The rate of new home buying customers arriving is one every three hours. What is the probability at…
A: Given: Customer arriving per every three hours = 1 Average customer arriving per every 18 hours λ =…
Q: 3. The probability density function of the length of a cutting blade is f(x)=1.25 for 74.6 < x <…
A:
Q: A lock code has 4 digits in a specific order, the digits are between 0-9 (so 10 total numbers to…
A: Introduction In the given scenario, a lock with 4 digits has been provided. We need to find out the…
Q: Q6. Consider a population consisting of 1,2,3,4 and 5. Supposed samples of size 2 are drawn from…
A: Given that Population: 1,2,3,4,5 Sample size: 2 We have to find b..List down all the possible…
Q: To study the effect of temperature on yield in a chemical process, five batches were produced at…
A: Given No. Of levels =3=k N=5+5+5=15 For mentioned data we have to calculate anova table. SSB: sum of…
Q: Find the standard deviation of 234,180,315,580,508,331,448 390,276,432
A: The question is about measures Give data : To find : Std. deviation of a given data
Q: A company had 15 employees whose salaries are shown below. Find the standard deviation $7,500…
A: Salaries(x) of given 15 employees, so n=15 x x2 7500 56250000 15500 240250000 26400…
Q: The median yearly salary paid to the 24 players on soccer team is $24,000 less than the median…
A: Median is the measure of central tendency. It does not include all the observation involve in the…
Q: A population mean is 15. The sample mean is 13.75, and the sample standard deviation is 1.8. The…
A: Single population mean Z- test: If the sample is large and the population standard deviation is…
Q: A random sample of 9 students selected from the student body of a high school had an average age of…
A: It is given that Sample size n = 9 Sample mean M = 14 Population SD = 1
Q: 1. Mark's Hardware has a number of bikes and trikes for sale. There are 27 seats and 60 wheels, all…
A: The detailed answer of que.1 with understanding is presented in the photo attached below. Note:…
Q: R1.3. Singers by parts The boxplots display the heights (in inches) of 130 members of a choir by the…
A: The boxplots display the heights (in inches) of 130 members of a choir by the part they sing. The…
Q: Determine the sample mean pulse of the following two simple random samples of size 3. Sample 1:…
A: Given: Sample size, n=3 Student Pulse Perpectual Bempah 68 Megan Brooks 68 Jeff…
Q: Given a data set consisting of 33 unique whole number observations, its five-number summary is:…
A: For a considered data set, the five-number summary essentially explains the descriptive statistics…
Q: 8. Let X have a negative binomial distribution with rand P=0.6. If the mean of X is 5 then r equal…
A: 8)Givenp=0.6q=1-pq=1-0.6q=0.4Mean of X = 5A random variable X~Negative binomial…
Q: One of the steps involved with buying a home is a home inspection. We cannot be sure how much time…
A: We are given the following X = time to inspect a house in minutes. X ~ U(30,150) We need to find the…
Q: Administrators at University X were interested in the amount of hours underclassmen and…
A: Graphs are used to visualize the various data set. Bar graphs are used to visualize the categorical…
Q: For a data set of the pulse rates for a sample of adult females, the lowest pulse rate is 36 beats…
A: We have given that Mean (x̅) = 78Standard deviations (s) = 22.6
Q: 6. In Table 3, calculate the overall number of expected deaths for Population A and for Population…
A: Given Table 1 Population A Population B Age (Yrs) # people % of pop. #…
Q: Here is a sample data set. 403 414.2 422 428.4 433 437.9 438 438.5 440.3 442.6 458.4 459.5 460.6…
A: The objective is to find the first and the third quartiles, Interquartile range and lower &…
Q: Why is the scientific method a useful tool for making predictions? Answer it to 3 sentences.
A: When performing experiments and investigating observations, the scientific method is a process that…
Q: The National Institute of Mental Health published an article stating that in any two-year period,…
A: Let P be the true proportion of American adults suffer from depression or depressive illness. Here…
Q: the swab results are normally distributed with a mean of 10 and a standard deviation of 3. For bags…
A: For bags that do contain prohibited explosive chemicals, the swab results are normally distributed…
last item only 0.2781 is wrong
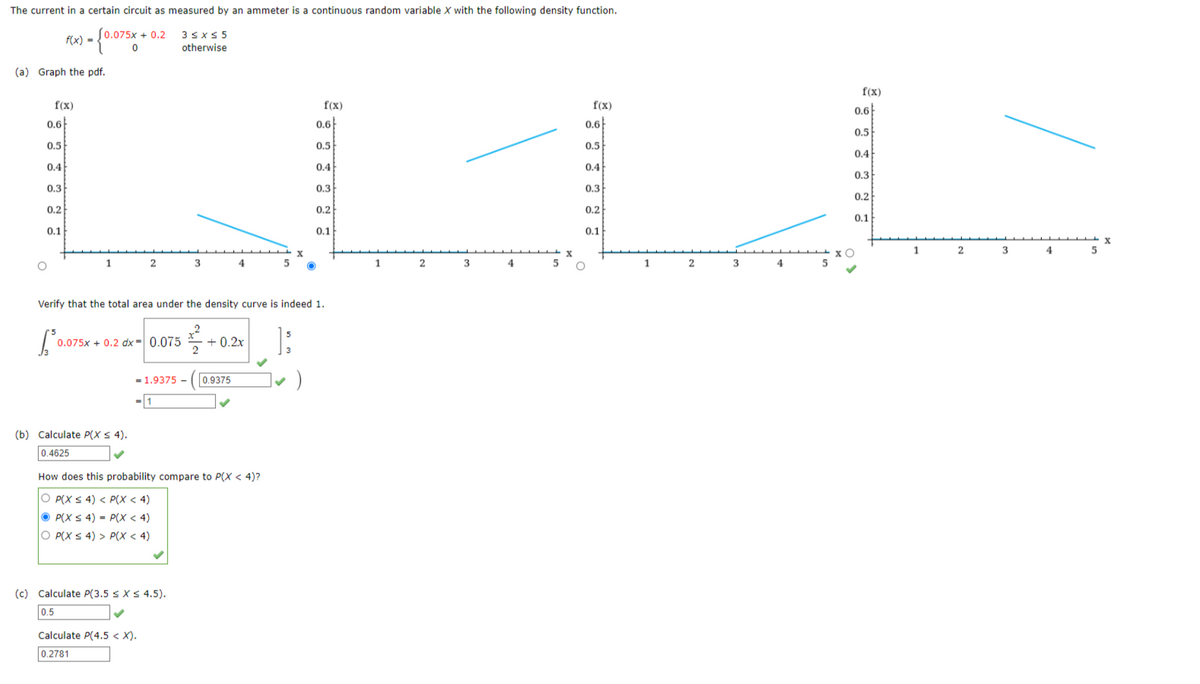
Trending now
This is a popular solution!
Step by step
Solved in 2 steps with 2 images
- The current in a certain circuit as measured by an ammeter is a continuous random variable X with the following density function. What is P(X ≤ 4)? What is P(4.5 < X)?The current in a certain circuit as measured by an ammeter is a continuous random variable X with the following density function: f(x ) = { .075x + .2 3< x < 5 0 otherwise a. Graph the pdf and verify that the total area under the density curve is indeed b. Calculate P(X < 4). How does this probability compare to P(X <4)? c. Calculate .P(3.5< X< 4.5) and also .P(4.5 < X).For a certain psychiatric clinic suppose that the random variable X represents the total time (in minutes) that a typical patient spends in this clinic during a typical visit (where this total time is the sum of the waiting time and the treatment time), and that the random variable Y represents the waiting time (in minutes) that a typical patient spends in the waiting room before starting treatment with a psychiatrist. Further, suppose that X and Y can be assumed to follow the bivariate density function fXY(x,y)=λ2e−λx, 0<y<x, where λ > 0 is a known parameter value. (a) Find the marginal density fX(x) for the total amount of time spent at the clinic. (b) Find the conditional density for waiting time, given the total time. (c) Find P (Y > 20 | X = x), the probability a patient waits more than 20 minutes if their total clinic visit is x minutes. (Hint: you will need to consider two cases, if x < 20 and if x ≥ 20.)
- On a production line, parts are produced with a certain average size, but the exact size of each part varies due to the imprecision of the production process. Suppose that the difference between the size of the pieces produced (in millimeters) and the average size, which we will call production error, can be modeled as a continuous random variable X with a probability density function given by f(x) = 2, 5e^(-5|x|), for x E R (is in the image). Parts where the production error is less than -0.46 mm or greater than 0.46 mm should be discarded. Calculate (approximating to 4 decimal places): a) What is the proportion of parts that the company discards in its production process? b) What is the proportion of parts produced where the production error is positive? c) Knowing that for a given part the production error is positive, what is the probability of this part being discarded?The current in a certain circuit as measured by an ammeter is a continuous random variable X with the following density function. f(x) = { 0.075x + 0.2 3 ≤ x ≤ 5 0 otherwise Calculate P(3.5 ≤ X ≤ 4.5). Calculate P(4.5 <The current in a certain circuit as measured by an ammeter is a continuous random variable X with the following density function, f(x) = 0.05x + 0.3 if 3 <= x <= 5, and 0 otherwise. (a) Calculate P(X ≤ 4). (b) Calculate P(3.5 ≤ X ≤ 4.5). (c) Calculate P(4.5 < X).
- Suppose that two continuous random variables X and Y have a joint probability densityfunction f(x, y) = A(x − 3)y for -2≤x≤3 and 4≤y≤6a) What is the value of A?b) What is P(0≤x≤1 and 4≤y≤5)?c) Construct the marginal probability density functions.d) Are the random variables X and Y independent?e) If Y = 5, what is the conditional probability density function of X?f) What are the expectations and variances of the random variables X and Y ?g) What is the covariance of X and Y?h) What is the correlation between X and Y?Suppose random variable X has a density function f ( x ) = { 2 /x 2 , 1 ≤ x ≤ 2 0 , o t h e r w i s e . Then E[X4] =?The PDF of a continuous random variable X is as follows: f(X)= c(4x2 - 2x2) 0<* x <* 2 (*less or equal to) a. For this to be a proper density function, what must be the value of c ?
- Suppose that two-dimensional continuous random variable (X, Y) has joint probability density function given by f(x,y) = 24xy, x is less than equal to 1 and greater than equal to 0, y is less than equal to 1 and greater than equal to 0, x+y is less than equal to 1 and greater than equal to 0. Check that E(Y) = E[E(Y|X)] and V(Y) = E[V(Y|X)] + V[E(Y|X)].A continuous random variable has a density function f(x)= 2(5-x)/5 , where 2<x<3. Calculatethe following probability correct up to 3 decimal places, and make the graph for part (a) only in Answer sheet:P (x < 2.5)P (x > 2.2)P (2.1 ≤A continuous random variable has a density function f (X)=2(5-x)/5 , where 2<x<3. Calculate the following probability correct up to 3 decimal places, and make the graph for part (a) only in Answer sheet: P (x < 2.5) P (x > 2.2) P (2.1 ≤ ? ≤ 2.7)