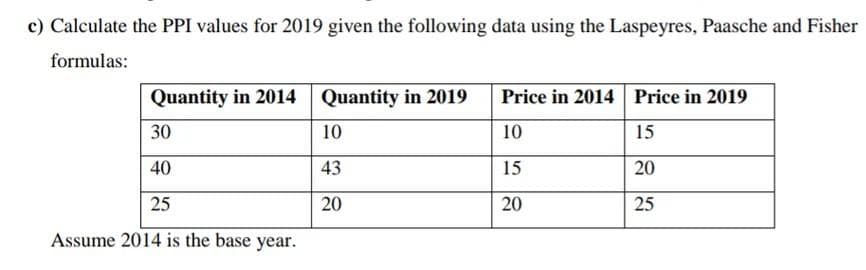
c) Calculate the PPI values for 2019 given the following data using the Laspeyres, Paasche and Fisher formulas: Quantity in 2014 Quantity in 2019 Price in 2014 Price in 2019 30 10 10 15 40 43 15 20 25 20 20 25 Assume 2014 is the base year.


Q: The equation S = I + NCO describes the savings market for an entire national economy engaged in…
A: Savings in an economy often utilized to either invest in domestic financial products or invest in…
Q: discuss the topic Consumer Price Index
A: Economists use different indexes to analyze the change in economic variables in the market.
Q: 7.14. Demand for car motor fuel. An economist wants to model annual per capita demand, y, for…
A:
Q: Mexico and Brazil have very different trading patterns. While Mexico trades mainly with the United…
A: The gravity model of trade has been useful in identifying the trading patterns of the various…
Q: onstruct the cost-of-living index number for 2020 on the basis of 2018 from the given data. Advice a…
A: Given: Commodity P0 P1 Weight A 200 400 50 B 200 350 40 C 100…
Q: AS3 AS1 AS2 Real Domestic Output, GDP In the diagram, a shift from AS1 to AS3 might be caused by…
A: The decrease in Aggregate supply or leftward shift in AS curve will be caused by any factors that…
Q: 4. What are national savings S = Sp + Sg ? [Your answer should just be a number, i.e. should not…
A: According to the conditions given Price of per fish =$3 Price of per fishing rod=$45 In a year…
Q: During 2020, Nation Z produced only 10 goods. Goods A, B C, D and E are intermediate goods. Goods F,…
A: Nominal GDP is the total value of the goods and services produced in the country's economy over a…
Q: In the December, 1969, American Economic Review (pp. 886-896), Nathanial Leff reports the following…
A: Given information log S/Y = 7.3439 + 0.1596 log Y/N + 0.0254 log G - 1.3520 log D1 - 0.3990 log D2…
Q: The population of China has grown at an annual rate of 1.1% since 1987, while over the same period…
A: aNSWER IS GIVEN BELOW
Q: farmer grows strawberries, and sells the strawberries to local farm-to-table restaurants and…
A: Since you have posted a question with multiple sub-parts, we will solve the first three sub-parts…
Q: Which of the following is an example of a continuous variable? The gender of each student in a…
A: Continous variable is defined in random variables when the random variable can take any value in…
Q: A study by University of Minnesota economist, Joel Waldfogel, estimated the difference in the actual…
A: Solution - Given in the question - According to study that average recipient's valuation was…
Q: employee turnover. Gender is an example on which of the following variables? Moderating variable…
A: Econometrics is a part of economics that helps to study the relationship between various variables.…
Q: Comparative Statics. For each pair of variables, indicate whether the relation- ship is positive,…
A: 1)Price of office space-building height-Positive. 2)Price of office space-willingness to pay for…
Q: FCI owns 10 apartment buildings in a college town, which it rents exclusively to students. Each…
A: Demand function explains the functional relationship between changes in the quantity demanded of a…
Q: Aggregate hours a. are the total number of hours worked by people holding full time jobs. b. are…
A: Aggregate hours is a statistic which represents the sum of hours worked by all employed people…
Q: graph and label as either direct or indirect the relationships you would expect to find between a)…
A: (a.)The number of inches of rainfall per month and the sale of umbrellas:If inches of rainfall…
Q: If the annual rate of world oil consumption t years after 1970 is modeled by the equation R(t) =…
A: We are going to find the total consumption of oil barrels in a period from 1976 to 1980 to answer…
Q: A discussion relating to the attributes that make the Gini coefficient a desirable means of…
A: The Gini Coefficient indicates how well the economic system of a country distributes the income…
Q: The demand function for apples is the following. Qn = 10 – Pn + 0.2Y +0.5 Pc – 2Ps + 0.2A Where:…
A: The price elasticity of demand is an economic statistic that measures the increase in the quantity…
Q: Question 7: The following regressions are based on the CPI data for the United States for the period…
A: Stationary Stochastic processes are those process which have a constant mean and constant variance…
Q: This is not a writing assignment, this is a multiple-choice question Which of the below statements…
A: GDP per capita = GDP / Population of the country In real terms, real GDP of India is greater than…
Q: The GDP data collected for the current year for a number of countries are called _____. Select one:…
A: In cross-sectional data, there are several variables at the same point in time. Cross-sectional data…
Q: Describe the gravity model – specify the variables, use an example of Canada and the USA, or Mexico…
A: The Gravity model is the model of international trade and it relates trade between only two…
Q: In the following examples, identify the exogenous (or independent) variable and the endogenous (or…
A: A variable in a mathematical model that is modified or decided by its relationship with other…
Q: Household spending on education is included in consumption of services. Select one: a. False b. True
A: Household spending on education is included in the consumption of services. Select one: a. False…
Q: Although the virus has delayed the budget until October .... last week the secretary to the Treasury…
A: According to the article above, 900,000 people lost their jobs during the period (although…
Q: using words and mathematical notation, why the Ordinary Least Squares method might not be the best…
A: The economics as a study is basically based upon the idea of the limited amount of resources which…
Q: Impact of Covid 19 on Macroeconomic indicators in Malaysia
A: 1. Putting money into the hands of the common man through fiscal stimulus can expand demand in the…
Q: The US Census Bureau tracks the median price for new hoe sales by month of the year. The median…
A: Since you have asked multiple questions, we will solve the first question for you. If you want any…
Q: The price of a Big Mac in the United States in 2015 was $4.79. Using the Big Mac burger as a…
A: PPP adjustment factor can be calculated by using the following formula: When the US big Mac price is…
Q: Problem 2: Consider the following National Income determination model: Y=C+I0+G0 C=500+0.75(Y−T)…
A: The calculation of a nation's wellbeing is done using many methods including the method of…
Q: -income
A: This is the concept of purchasing power.
Q: Each term (3 months) the current group of economics students completed a questionnaire as to how…
A: The marginal propensity to consume illustrates how much a consumer is willing to spend out of all…
Q: 2019 world GDP 87.555 trillion Current U.S. GDP 20,893,746 Calculate the US. share of world GDP (%)…
A: 2019 World GDP = 87.555 trillion i.e. 87,500,000,000,000 Current U.S GDP = 20,893,746
Q:
A: Real per capita GDP shows total economic output measurement of a nation which is divided by people…
Q: Given the following data table: X Y 21 68 72 55 38 59 57 57 45 61 What is the…
A: The correlation coefficient measures the strength of the relationship between two variables. The…
Q: Muscat Municipality maintains lots of data about its daily work activities. Give an example of…
A: Master Data:- Master data includes the data for various categories inside the Muscat Municipality…
Q: There are a number of measures of aggregate economic activity, such as GDP, GNP, national income,…
A: a) Disposable income refers to the gross personal income which is the income after deduction of…
Q: Preamble for Questions 1-8. Consider a fish/fishing rod economy, with Crusoe and Friday the entire…
A: Y=1050 GDP = $4000 50 fishing rods created by Friday and 1000 fish caught by Crusoe. The price of…
Q: Country X had the following values for its macroeconomic indicators (in EUR bn): Indicator Value…
A: calculation of GDP using income approach- Compensation of employees +Gross operating surplus +net…
Solve and working.

Step by step
Solved in 2 steps


- Construct the cost-of-living index number for 2020 on the basis of 2018 from the given data. Advice a donor agency on what course action to take if the information is meant to help them make a decision on some food stipend being for a social protection program in Kenya. Commodities PRICE Weights 2018 2020 A 200 400 50 B 200 350 40 C 100 150 65 D 80 120 45 E 60 180 20 F 90 157.5 60 G 300 585 100 b. The average prices and quantities of six items grown in Nakuru County are shown in the following table: 2020 2021 Items Price (Kshs/Kg) Quantity (Kg,000) Price (Kshs/Kg) Quantity (Kg,000) Pineapples(A) 10 6 14 8 Oranges(B) 10 8 15 14 Bananas(C) 15 8 20 16 Beans(D) 30 12 25 20 Wheat(E) 40 15 60 21 Millet(F) 50 10 80 16 Using 2020 as base year, compute Kelly’s and Fishers Price index numbers…Define the term cost-of-living index?This is an exercise depends on the statement below: During covid-19 pandemic, there is a household (s) that requested financial assistance from the government and private institutions, to support their housing expenses. What do you think? Why they needs financial assistance?
- How do federal agencies typically value lives saved by health, safety, and environmental regulations? A. Agencies consider medical expenses, pain and suffering, lost wages, and funeral and burial expenses B. Agencies ask individuals how much they would pay to avoid dying and average the results for the population C. Agencies use labor-market data to determine how much individuals are willing to pay to avoid (or, willing to accept to face) small fatality risks and use this information to generate a value of statistical life D. (A), (B), and (C) E. (B) and (C)The data you will focus on is for Wages and Salaries(row 8), Paid Leave (row 10), Life Insurance (row 20), Health Insurance (row21), Short-term andLong-term Disability Insurance (rows 22 and 23, respectively), and Retirement and Savings (row24). These numbers represent the cost per hour worked to the employer for providing workerswith particular benefits and are for the third quarter of 2022. For example, the averageemployer’s cost per hour worked for base wages and salaries equals $28.88 in the third quarter of2022. It costs employers $3.10 per hour to provide workers with paid leave, etc.Questions:1. What is the total compensation per hour employers provide to their workers? For this,add up all of the components selected as instructed in the previous paragraph. Do not usethe total provided in row 7 of the spreadsheet.2. Using your answer to question 1, what is the percentage of the total that comes fromwages, and what percentage comes from total non-wage benefits?3. Using your answer…Discuss data analysis in qualitative research detailing how a researcher prepares qualitative data for analysis. Inyour discussion, distinguish between quantitative and qualitative data analysis using examples where appropriate.
- Over the last several decades improvements in computer software, hardware and robotics have dramatically altered the ability of machines to do complex repetitive tasks. Discuss the implications for semi-skilled skilled workersas a result of this improvement. Discuss how the cost of the new technology influences the choice of inputs used in production and the rate of adoption of the new technology. Can you please answer this question so there will be no plagiarism, you have answer for this question in your website, but more likely it is already copied by someone elseI need help determining which of the following.Suppose the Kalamazoo Brewing Company (KBC) currently sells its microbrews in a seven-state area: Illinois, Indiana, Michigan, Minnesota, Mississippi, Ohio, and Wisconsin. The company’s marketing department has collected data from its distributors in each state. This data consists of the quantity and price (per case) of microbrews sold in each state, as well as the average income (in thousands of dollars) of consumers living in various regions of each state. The data for each state are available via the link below--please note there are multiple tabs at the bottom of the spreadsheet, each refers to one of the seven states selling the Kalamazoo Brewing Company’s microbrews.Excel Data FileAssuming that the underlying demand relation is a linear function of price and income, use your spreadsheet program to obtain least squares estimates of Wisconsin’s demand for KBC microbrews.Instruction: If the estimate is negative, enter a negative number (-) in the equation. Enter your responses…
- Graph and label as either direct or indirect the relationships you would expect to find between (a) the number of inches of rainfal per month and the sale of umbrellas, (b) the amount of tuition and the level of enrollment at a university, and (c) the popularity of an entertainer and the price of her concert tickets.When it comes to making suggestions, does Porter's published work incorporate any particular types of data?This is from my history book. Please answer ASAP Question 1. What is the total crude steel prodution of China from 1980 to 2000. Question 2. What is the total crude steel prodution of Korea from 1980 to 2000.
