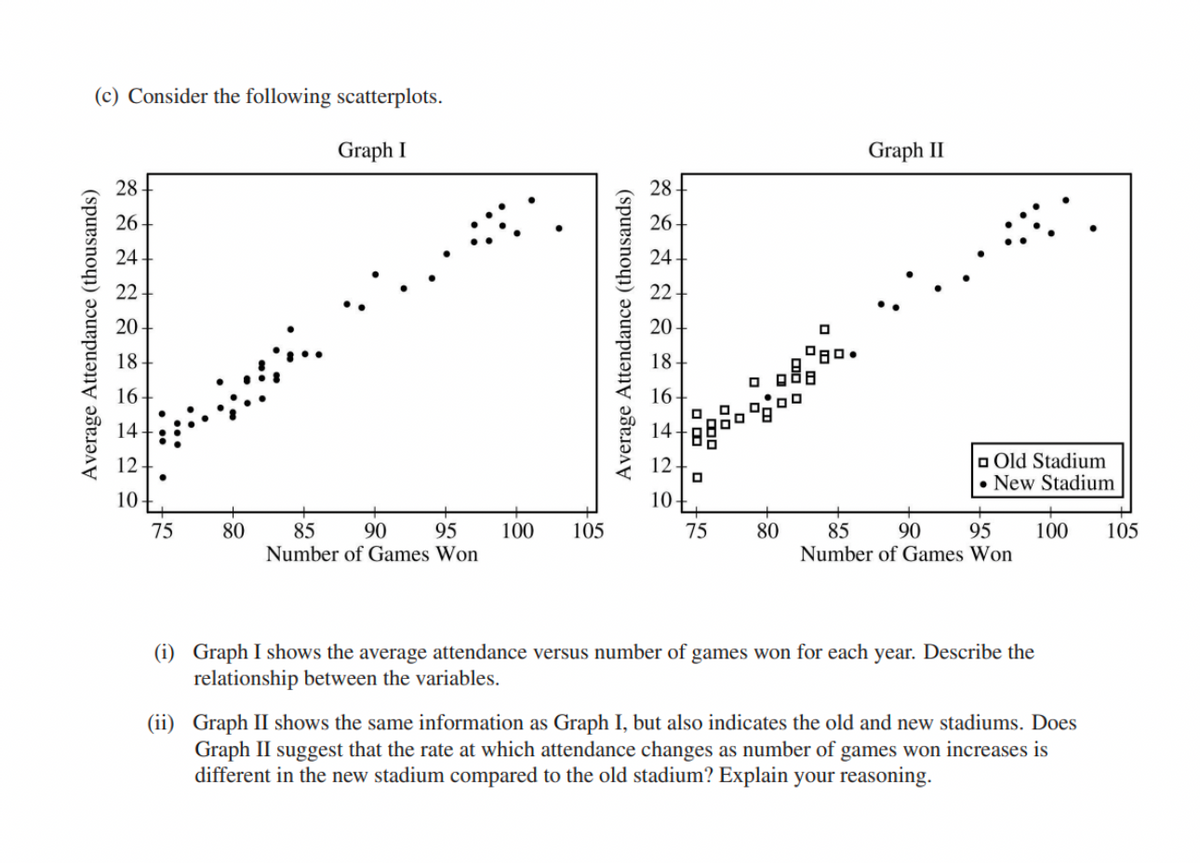
(c) Consider the following scatterplots. Graph I Graph II 28 28 - 26 26- 24 24 22 22 20- 20 18 - 18- 16 16- 14 14- o Old Stadium • New Stadium 12 12 - 10- 10- 85 Number of Games Won 75 80 85 Number of Games Won 90 95 100 105 75 80 90 95 100 105 (i) Graph I shows the average attendance versus number of games won for each year. Describe the relationship between the variables. (ii) Graph II shows the same information as Graph I, but also indicates the old and new stadiums. Does Graph II suggest that the rate at which attendance changes as number of games won increases is different in the new stadium compared to the old stadium? Explain your reasoning. Average Attendance (thousands) Average Attendance (thousands)
(c) Consider the following scatterplots. Graph I Graph II 28 28 - 26 26- 24 24 22 22 20- 20 18 - 18- 16 16- 14 14- o Old Stadium • New Stadium 12 12 - 10- 10- 85 Number of Games Won 75 80 85 Number of Games Won 90 95 100 105 75 80 90 95 100 105 (i) Graph I shows the average attendance versus number of games won for each year. Describe the relationship between the variables. (ii) Graph II shows the same information as Graph I, but also indicates the old and new stadiums. Does Graph II suggest that the rate at which attendance changes as number of games won increases is different in the new stadium compared to the old stadium? Explain your reasoning. Average Attendance (thousands) Average Attendance (thousands)

Algebra & Trigonometry with Analytic Geometry
13th Edition
ISBN:9781133382119
Author:Swokowski
Publisher:Swokowski
Chapter9: Systems Of Equations And Inequalities
Section9.4: Linear Programming
Problem 1E

Related questions
Question
Transcribed Image Text:(c) Consider the following scatterplots.
Graph I
Graph II
28 -
28 -
26
26-
24
24 -
22
22 -
20
20-
18
18+
O日ロ。
16
16-
14
14-
o Old Stadium
New Stadium
12
12
10
10-
75
80
85
Number of Games Won
90
95
100
105
75
80
85
Number of Games Won
90
95
100
105
(i) Graph I shows the average attendance versus number of games won for each year. Describe the
relationship between the variables.
(ii) Graph II shows the same information as Graph I, but also indicates the old and new stadiums. Does
Graph II suggest that the rate at which attendance changes as number of games won increases is
different in the new stadium compared to the old stadium? Explain your reasoning.
Average Attendance (thousands)
Average Attendance (thousands)
Transcribed Image Text:(d) Consider the three variables: number of games won, year, and stadium. Based on the graphs, explain
how one of those variables could be a confounding variable in the relationship between average
attendance and the other variables.
Expert Solution
This question has been solved!
Explore an expertly crafted, step-by-step solution for a thorough understanding of key concepts.

This is a popular solution!

Trending now
This is a popular solution!

Step by step
Solved in 3 steps with 2 images

Recommended textbooks for you
Algebra & Trigonometry with Analytic Geometry
Algebra
ISBN:
9781133382119
Author:
Swokowski
Publisher:
Cengage
Algebra & Trigonometry with Analytic Geometry
Algebra
ISBN:
9781133382119
Author:
Swokowski
Publisher:
Cengage