Prior to graduation, a high school class was surveyed about its plans. The table displays the results for white and minority students (the Minority group included African-American, Asian, Hispanic, and Native American students). Complete parts a) through d). White Minority 25 4-year college 2-year college Military Employment Other 74 31 10 10 3 18 6. 16 White Minority a) Find the conditional distributions (percentages) of plans for the white students. 4-year college 2-year college Military Employment Other (Round to one decimal place as needed.) % % % Minority % White 4-year college 2-year college Military b) Find the conditional distributions (percentages) of plans for the minority students. % (Round to one decimal place as needed.) Next 245 PM 4/27/2022 74°F P Type here to search
Prior to graduation, a high school class was surveyed about its plans. The table displays the results for white and minority students (the Minority group included African-American, Asian, Hispanic, and Native American students). Complete parts a) through d). White Minority 25 4-year college 2-year college Military Employment Other 74 31 10 10 3 18 6. 16 White Minority a) Find the conditional distributions (percentages) of plans for the white students. 4-year college 2-year college Military Employment Other (Round to one decimal place as needed.) % % % Minority % White 4-year college 2-year college Military b) Find the conditional distributions (percentages) of plans for the minority students. % (Round to one decimal place as needed.) Next 245 PM 4/27/2022 74°F P Type here to search

MATLAB: An Introduction with Applications
6th Edition
ISBN:9781119256830
Author:Amos Gilat
Publisher:Amos Gilat
Chapter1: Starting With Matlab
Section: Chapter Questions
Problem 1P

Related questions
Question
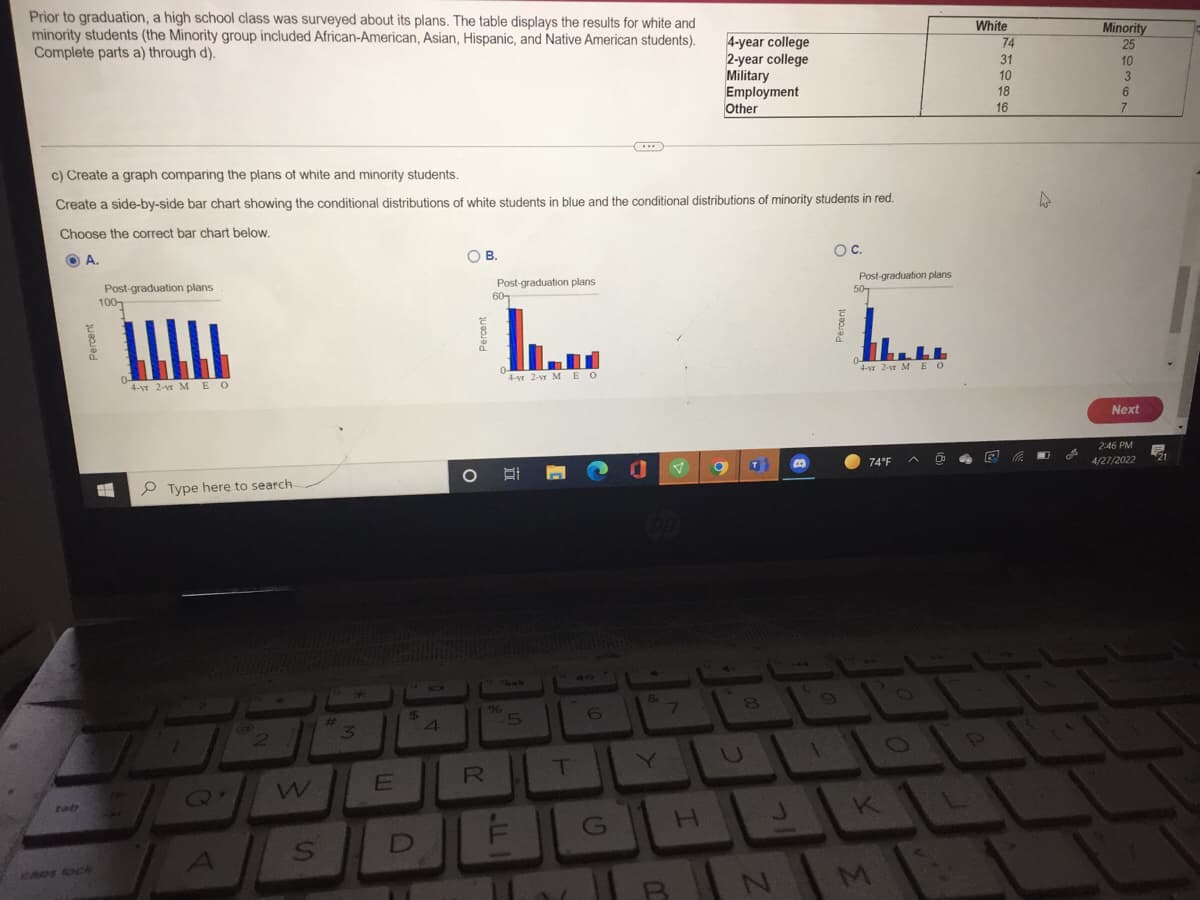
Transcribed Image Text:Prior to graduation, a high school class was surveyed about its plans. The table displays the results for white and
minority students (the Minority group included African-American, Asian, Hispanic, and Native American students).
Complete parts a) through d).
White
74
Minority
4-year college
2-year college
Military
Employment
Other
25
31
10
10
3
18
6.
16
7.
c) Create a graph comparing the plans of white and minority students.
Create a side-by-side bar chart showing the conditional distributions of white students in blue and the conditional distributions of minority students in red.
Choose the correct bar chart below.
OC.
O A.
OB.
Post-graduation plans
100-
Post-graduation plans
60,
Post-graduation plans
50-
L.
4-vr 2-r M EO
4-vr 2-vr M EO
0-
4-vr 2-vr M EO
Next
2:46 PM
74°F
4/27/2022
P Type here to search
&
80
96
60
4
Y
R
Q'
tat
G
M.
CROs lock
queaued
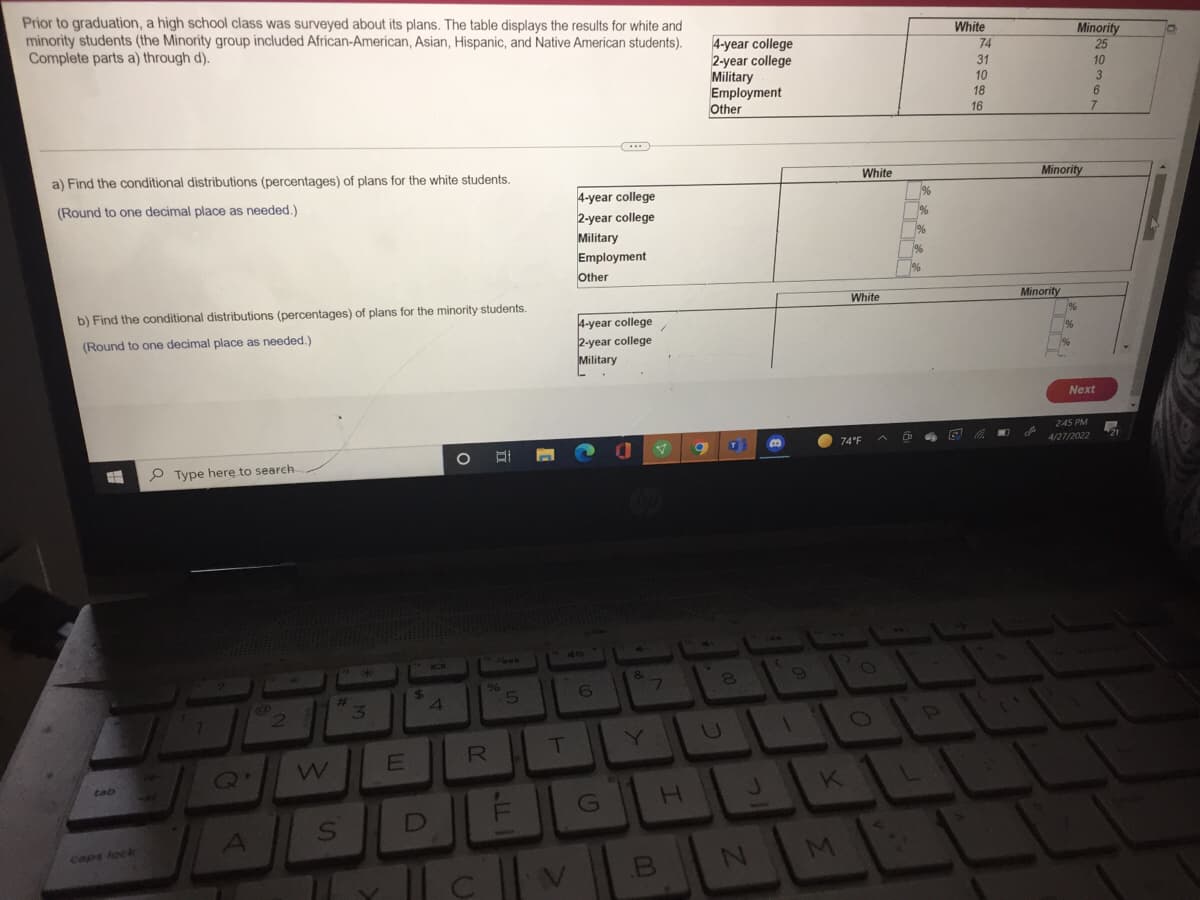
Transcribed Image Text:Prior to graduation, a high school class was surveyed about its plans. The table displays the results for white and
minority students (the Minority group included African-American, Asian, Hispanic, and Native American students).
Complete parts a) through d).
White
Minority
4-year college
2-year college
Military
Employment
74
25
31
10
10
3
6.
18
Other
16
a) Find the conditional distributions (percentages) of plans for the white students.
White
Minority
4-year college
2-year college
Military
Employment
Other
(Round to one decimal place as needed.)
%
%
%
%
b) Find the conditional distributions (percentages) of plans for the minority students.
White
Minority
%
4-year college
2-year college
(Round to one decimal place as needed.)
%
Military
Next
245 PM
74°F
4/27/2022
P Type here to search
&
7.
96
23
4.
7
2.
R
W
tab
54
A
caps lock
MI
Expert Solution
This question has been solved!
Explore an expertly crafted, step-by-step solution for a thorough understanding of key concepts.

This is a popular solution!

Trending now
This is a popular solution!

Step by step
Solved in 2 steps with 2 images

Recommended textbooks for you
MATLAB: An Introduction with Applications
Statistics
ISBN:
9781119256830
Author:
Amos Gilat
Publisher:
John Wiley & Sons Inc

Probability and Statistics for Engineering and th…
Statistics
ISBN:
9781305251809
Author:
Jay L. Devore
Publisher:
Cengage Learning

Statistics for The Behavioral Sciences (MindTap C…
Statistics
ISBN:
9781305504912
Author:
Frederick J Gravetter, Larry B. Wallnau
Publisher:
Cengage Learning
MATLAB: An Introduction with Applications
Statistics
ISBN:
9781119256830
Author:
Amos Gilat
Publisher:
John Wiley & Sons Inc
Probability and Statistics for Engineering and th…
Statistics
ISBN:
9781305251809
Author:
Jay L. Devore
Publisher:
Cengage Learning
Statistics for The Behavioral Sciences (MindTap C…
Statistics
ISBN:
9781305504912
Author:
Frederick J Gravetter, Larry B. Wallnau
Publisher:
Cengage Learning

Elementary Statistics: Picturing the World (7th E…
Statistics
ISBN:
9780134683416
Author:
Ron Larson, Betsy Farber
Publisher:
PEARSON

The Basic Practice of Statistics
Statistics
ISBN:
9781319042578
Author:
David S. Moore, William I. Notz, Michael A. Fligner
Publisher:
W. H. Freeman

Introduction to the Practice of Statistics
Statistics
ISBN:
9781319013387
Author:
David S. Moore, George P. McCabe, Bruce A. Craig
Publisher:
W. H. Freeman