(c) Describe the sampling distribution of p, the proportion of people who are satisfied with the way things are going in their life. Be sure to verify the model requirements. Since the sample size is | than 5% of the population size and np(1- p) = D210, the distribution of p is with ua h Hn =and a = %3D (Round to three decimal places as needed.)
(c) Describe the sampling distribution of p, the proportion of people who are satisfied with the way things are going in their life. Be sure to verify the model requirements. Since the sample size is | than 5% of the population size and np(1- p) = D210, the distribution of p is with ua h Hn =and a = %3D (Round to three decimal places as needed.)

Holt Mcdougal Larson Pre-algebra: Student Edition 2012
1st Edition
ISBN:9780547587776
Author:HOLT MCDOUGAL
Publisher:HOLT MCDOUGAL
Chapter11: Data Analysis And Probability
Section: Chapter Questions
Problem 8CR

Related questions
Topic Video
Question
just part C thank you!
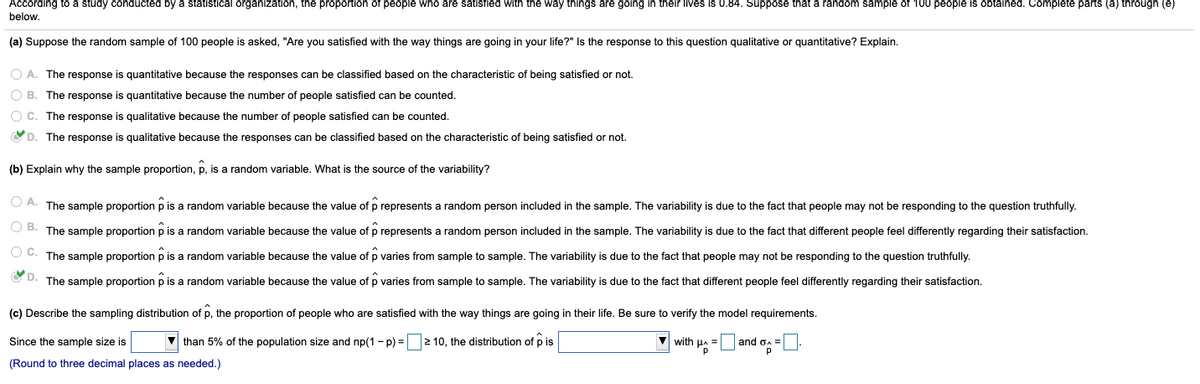
Transcribed Image Text:According to a study conducted by a statistical organization, the proportion of people who are satisfied with the way things are going in their Iives is 0.84. Suppose that a random sample of 100 people is obtained. Complete parts (a) through (e)
below.
(a) Suppose the random sample of 100 people is asked, "Are you satisfied with the way things are going in your life?" Is the response to this question qualitative or quantitative? Explain.
O A. The response is quantitative because the responses can be classified based on the characteristic of being satisfied or not.
O B. The response is quantitative because the number of people satisfied can be counted.
O C. The response is qualitative because the number of people satisfied can be counted.
OD. The response is qualitative because the responses can be classified based on the characteristic of being satisfied or not.
(b) Explain why the sample proportion, p, is a random variable. What is the source of the variability?
O A.
The sample proportion p is
random variable because the value of p represents a random person included in the sample. The variability is due to the fact that people may not be responding to the question truthfully.
O B. The sample proportion p is a random variable because the value of p represents a random person included in the sample. The variability is due to the fact that different people feel differently regarding their satisfaction.
O C. The sample proportion p is a random variable because the value of p varies from sample to sample. The variability is due to the fact that people may not be responding to the question truthfully.
D. The sample proportion p is a random variable because the value of p varies from sample to sample. The variability is due to the fact that different people feel differently regarding their satisfaction.
(c) Describe the sampling distribution of p, the proportion of people who are satisfied with the way things are going
their life. Be sure to verify the model requirements.
V than 5% of the population size and np(1 - p) =|
2 10, the distribution of p is
with P
| and o. =.
Since the sample size is
(Round to three decimal places as needed.)
Expert Solution
This question has been solved!
Explore an expertly crafted, step-by-step solution for a thorough understanding of key concepts.

This is a popular solution!

Trending now
This is a popular solution!

Step by step
Solved in 2 steps

Knowledge Booster


Learn more about
Need a deep-dive on the concept behind this application? Look no further. Learn more about this topic, statistics and related others by exploring similar questions and additional content below.Recommended textbooks for you
Holt Mcdougal Larson Pre-algebra: Student Edition…
Algebra
ISBN:
9780547587776
Author:
HOLT MCDOUGAL
Publisher:
HOLT MCDOUGAL
Holt Mcdougal Larson Pre-algebra: Student Edition…
Algebra
ISBN:
9780547587776
Author:
HOLT MCDOUGAL
Publisher:
HOLT MCDOUGAL