(c) Give an estimate of the average change in depression score change associated with a 1 kg/m increase in BMI change. (Round your answer to three decimal places.) d) Calculate a point estimate of the mean depression score change for a patient whose BMI change was 1.2 kg/m2. (Round your answer to three decimal places.)
(c) Give an estimate of the average change in depression score change associated with a 1 kg/m increase in BMI change. (Round your answer to three decimal places.) d) Calculate a point estimate of the mean depression score change for a patient whose BMI change was 1.2 kg/m2. (Round your answer to three decimal places.)

Chapter5: Exponential And Logarithmic Functions
Section5.5: Exponential And Logarithmic Models
Problem 4ECP

Related questions
Question
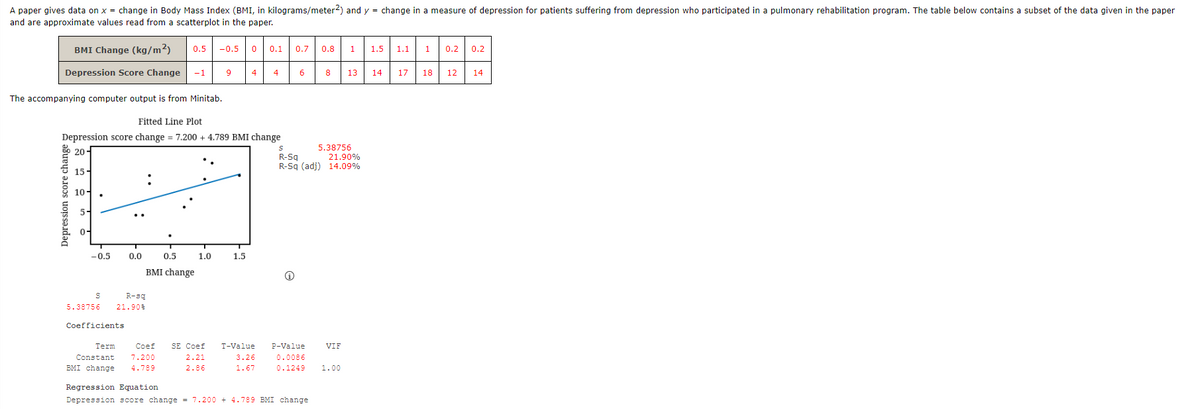
Transcribed Image Text:A paper gives data on x = change in Body Mass Index (BMI, in kilograms/meter2) and y = change in a measure of depression for patients suffering from depression who participated in a pulmonary rehabilitation program. The table below contains a subset of the data given in the paper
and are approximate values read from a scatterplot in the paper.
BMI Change (kg/m²)
1.5 1.1
0.2 | 0.2
0.5
-0.5
0.1
0.7
0.8
1
1
Depression Score Change
-1
9
4
4
6
8
13
14
17
18
12
14
The accompanying computer output is from Minitab.
Fitted Line Plot
Depression score change = 7.200 + 4.789 BMI change
* 20-
5.38756
R-Sq
R-Sg (adj) 14.09%
21.90%
15 -
:
10-
5-
..
0-
-0.5
0.0
0.5
1.0
1.5
BMI change
R-sq
5.38756
21.90%
Coefficients
Term
Coef
SE Coef
T-Value
P-Value
VIF
Constant
7.200
2.21
3.26
0.0086
BMI change
4.789
2.86
1.67
0.1249
1.00
Regression Equation
Depression score change = 7.200 + 4.789 BMI change
Depression score change
..
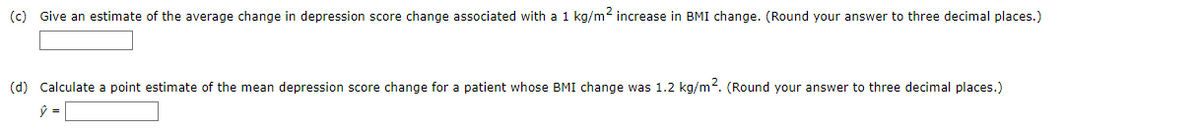
Transcribed Image Text:(c) Give an estimate of the average change in depression score change associated with a 1 kg/m2 increase in BMI change. (Round your answer to three decimal places.)
(d) Calculate a point estimate of the mean depression score change for a patient whose BMI change was 1.2 kg/m. (Round your answer to three decimal places.)
ý =
Expert Solution
This question has been solved!
Explore an expertly crafted, step-by-step solution for a thorough understanding of key concepts.

This is a popular solution!

Trending now
This is a popular solution!

Step by step
Solved in 2 steps

Recommended textbooks for you

Glencoe Algebra 1, Student Edition, 9780079039897…
Algebra
ISBN:
9780079039897
Author:
Carter
Publisher:
McGraw Hill

Algebra & Trigonometry with Analytic Geometry
Algebra
ISBN:
9781133382119
Author:
Swokowski
Publisher:
Cengage
Glencoe Algebra 1, Student Edition, 9780079039897…
Algebra
ISBN:
9780079039897
Author:
Carter
Publisher:
McGraw Hill
Algebra & Trigonometry with Analytic Geometry
Algebra
ISBN:
9781133382119
Author:
Swokowski
Publisher:
Cengage

Functions and Change: A Modeling Approach to Coll…
Algebra
ISBN:
9781337111348
Author:
Bruce Crauder, Benny Evans, Alan Noell
Publisher:
Cengage Learning