minimum shoulder girth is 87 cm and the maximum shoulder girth is 134 cm. The mean shoulder girth is 108.87 cm with a standard deviation of 10.12 cm. The mean height is 173.86 cm with a standard deviation of 9.41 cm. The correlation between height and shoulder girth is 0.655. a) Write the equation of the regression line for predicting height. Slope (round 3 decimal places): Intercept (round to nearest whole number): b) Interpret the slope in this context. When height is 0 cm, the shoulder girth in cm is expected to be b O For each additional cm in shoulder girth, the model predicts an additional bị cm in height O When shoulder girth is 0 cm, the height in cm is expected to be b For each additional cm in beight the model predicts an additional bu cm in shoulder girth
minimum shoulder girth is 87 cm and the maximum shoulder girth is 134 cm. The mean shoulder girth is 108.87 cm with a standard deviation of 10.12 cm. The mean height is 173.86 cm with a standard deviation of 9.41 cm. The correlation between height and shoulder girth is 0.655. a) Write the equation of the regression line for predicting height. Slope (round 3 decimal places): Intercept (round to nearest whole number): b) Interpret the slope in this context. When height is 0 cm, the shoulder girth in cm is expected to be b O For each additional cm in shoulder girth, the model predicts an additional bị cm in height O When shoulder girth is 0 cm, the height in cm is expected to be b For each additional cm in beight the model predicts an additional bu cm in shoulder girth

Glencoe Algebra 1, Student Edition, 9780079039897, 0079039898, 2018
18th Edition
ISBN:9780079039897
Author:Carter
Publisher:Carter
Chapter10: Statistics
Section10.5: Comparing Sets Of Data
Problem 13PPS

Related questions
Question
I only need help with questions A,C,D and E
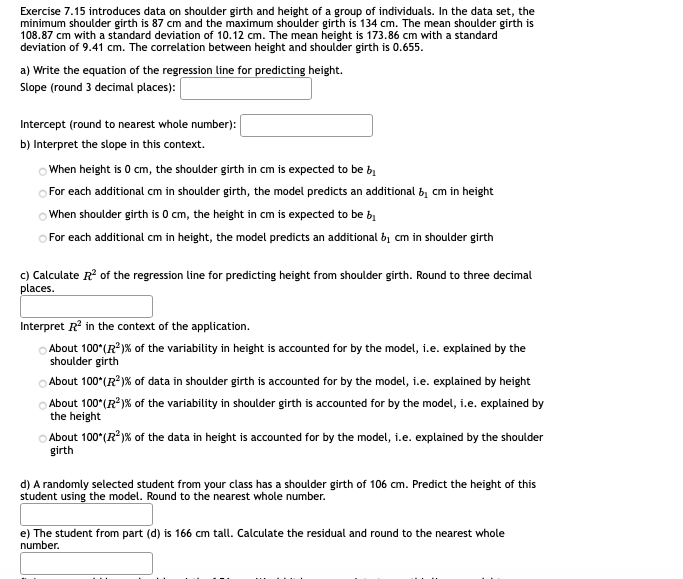
Transcribed Image Text:Exercise 7.15 introduces data on shoulder girth and height of a group of individuals. In the data set, the
minimum shoulder girth is 87 cm and the maximum shoulder girth is 134 cm. The mean shoulder girth is
108.87 cm with a standard deviation of 10.12 cm. The mean height is 173.86 cm with a standard
deviation of 9.41 cm. The correlation between height and shoulder girth is 0.655.
a) Write the equation of the regression line for predicting height.
Slope (round 3 decimal places):
Intercept (round to nearest whole number):
b) Interpret the slope in this context.
o When height is 0 cm, the shoulder girth in cm is expected to be b,
For each additional cm in shoulder girth, the model predicts an additional b cm in height
When shoulder girth is O cm, the height in cm is expected to be b
O For each additional cm in height, the model predicts an additional bị cm in shoulder girth
c) Calculate R? of the regression line for predicting height from shoulder girth. Round to three decimal
places.
Interpret R in the context of the application.
About 100*(R )% of the variability in height is accounted for by the model, i.e. explained by the
shoulder girth
About 100°(R )% of data in shoulder girth is accounted for by the model, i.e. explained by height
About 100*(R*)% of the variability in shoulder girth is accounted for by the model, i.e. explained by
the height
O About 100*(R )% of the data in height is accounted for by the model, i.e. explained by the shoulder
girth
d) A randomly selected student from your class has a shoulder girth of 106 cm. Predict the height of this
student using the model. Round to the nearest whole number.
e) The student from part (d) is 166 cm tall. Calculate the residual and round to the nearest whole
number.
Expert Solution
This question has been solved!
Explore an expertly crafted, step-by-step solution for a thorough understanding of key concepts.

This is a popular solution!

Trending now
This is a popular solution!

Step by step
Solved in 2 steps

Recommended textbooks for you
Glencoe Algebra 1, Student Edition, 9780079039897…
Algebra
ISBN:
9780079039897
Author:
Carter
Publisher:
McGraw Hill
Glencoe Algebra 1, Student Edition, 9780079039897…
Algebra
ISBN:
9780079039897
Author:
Carter
Publisher:
McGraw Hill