c) Interpret the data. Since there are no statistics included can you say whether the difference is significant? What type of statists would be helpful for analyzing the data in the figures?
c) Interpret the data. Since there are no statistics included can you say whether the difference is significant? What type of statists would be helpful for analyzing the data in the figures?

Elementary Geometry for College Students
6th Edition
ISBN:9781285195698
Author:Daniel C. Alexander, Geralyn M. Koeberlein
Publisher:Daniel C. Alexander, Geralyn M. Koeberlein
ChapterA: Appendices
SectionA.1: Algebraic Expressions
Problem 2E

Related questions
Question
For each graph:
a) Describe the graph:
b) Describe the data:
c) Interpret the data. Since there are no statistics included can you say whether the difference is significant? What type of statists would be helpful for analyzing the data in the figures?
Transcribed Image Text:Cla
Week12_Activity - Microsoft Word
Home
Insert
Page Layout
References
Mailings
Review
View
% Cut
A Find -
- 12
-A A
幸 T
Aal
Arial
AaBbCc AaBbCc AaBbCc AaBbCc AaB AaBbCcl AaBbCc AaBbCc AaBbC AaBbCc AaBbCc
A Copy
a Replace
B I U
个三。
Title
Change
Styles - Select -
Paste
abe x, x Aa
ab -
A
I Normal
T No Spaci. Heading 1 Heading 2
Subtitle
Subtle Em. Emphasis
Intense E..
Strong
Quote
Format Painter
Clipboard
Font
Paragraph
Styles
Editing
1. I X : 1: I : 2 3·: : 4 · . 5. : 6 · 7
Figure 1
A 1200
B 40-
+Strain 22
+ Strain 22
1000 Strain 17
* Strain 17
+ Strain 26
+Strain 26
30 -
800
600 -
20
400
10
200
24
48
72
96
120
24
48
72
96
120
Time (h)
Time (h)
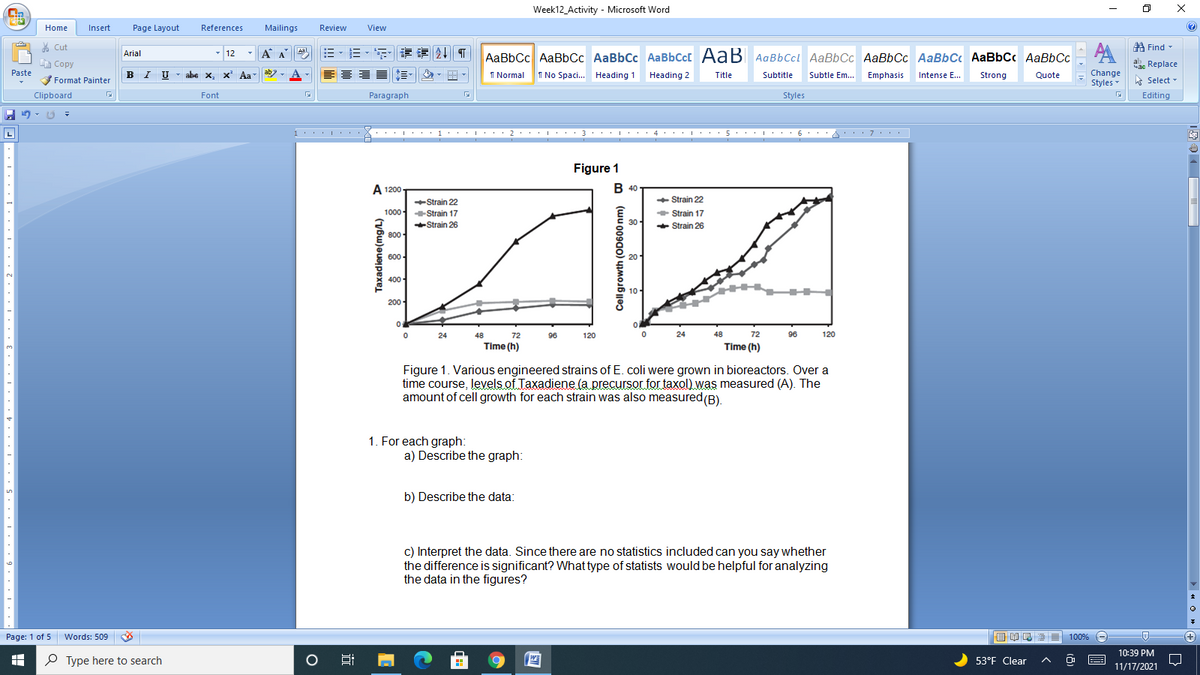
Figure 1. Various engineered strains of E. coli were grown in bioreactors. Over a
time course, levels of Taxadiene (a precursor for taxol) was measured (A). The
amount of cell growth for each strain was also measured(B).
1. For each graph:
a) Describe the graph:
b) Describe the data
c) Interpret the data. Since there are no statistics included can you say whether
the difference is significant? What type of statists would be helpful for analyzing
the data in the figures?
Page: 1 of 5
Words: 509
目 昆三
100% -
10:39 PM
O Type here to search
WE
53°F Clear
E
11/17/2021
Expert Solution
This question has been solved!
Explore an expertly crafted, step-by-step solution for a thorough understanding of key concepts.

Step by step
Solved in 2 steps

Recommended textbooks for you
Elementary Geometry for College Students
Geometry
ISBN:
9781285195698
Author:
Daniel C. Alexander, Geralyn M. Koeberlein
Publisher:
Cengage Learning

Mathematics For Machine Technology
Advanced Math
ISBN:
9781337798310
Author:
Peterson, John.
Publisher:
Cengage Learning,
Elementary Geometry for College Students
Geometry
ISBN:
9781285195698
Author:
Daniel C. Alexander, Geralyn M. Koeberlein
Publisher:
Cengage Learning
Mathematics For Machine Technology
Advanced Math
ISBN:
9781337798310
Author:
Peterson, John.
Publisher:
Cengage Learning,