C. A new sample is taken from the machine's output, and these are the exact wei liquid in each bottle: 349.21 ml, 352.12 ml, 350.14 ml, 350.82 ml, 350.07 ml, 3 ml, 350.50 ml, 349.75 ml, and 349.90ml. According to the charts created in pa and b of this question does this samnle indicate the process is control?
C. A new sample is taken from the machine's output, and these are the exact wei liquid in each bottle: 349.21 ml, 352.12 ml, 350.14 ml, 350.82 ml, 350.07 ml, 3 ml, 350.50 ml, 349.75 ml, and 349.90ml. According to the charts created in pa and b of this question does this samnle indicate the process is control?

Practical Management Science
6th Edition
ISBN:9781337406659
Author:WINSTON, Wayne L.
Publisher:WINSTON, Wayne L.
Chapter2: Introduction To Spreadsheet Modeling
Section: Chapter Questions
Problem 20P: Julie James is opening a lemonade stand. She believes the fixed cost per week of running the stand...

Related questions
Question
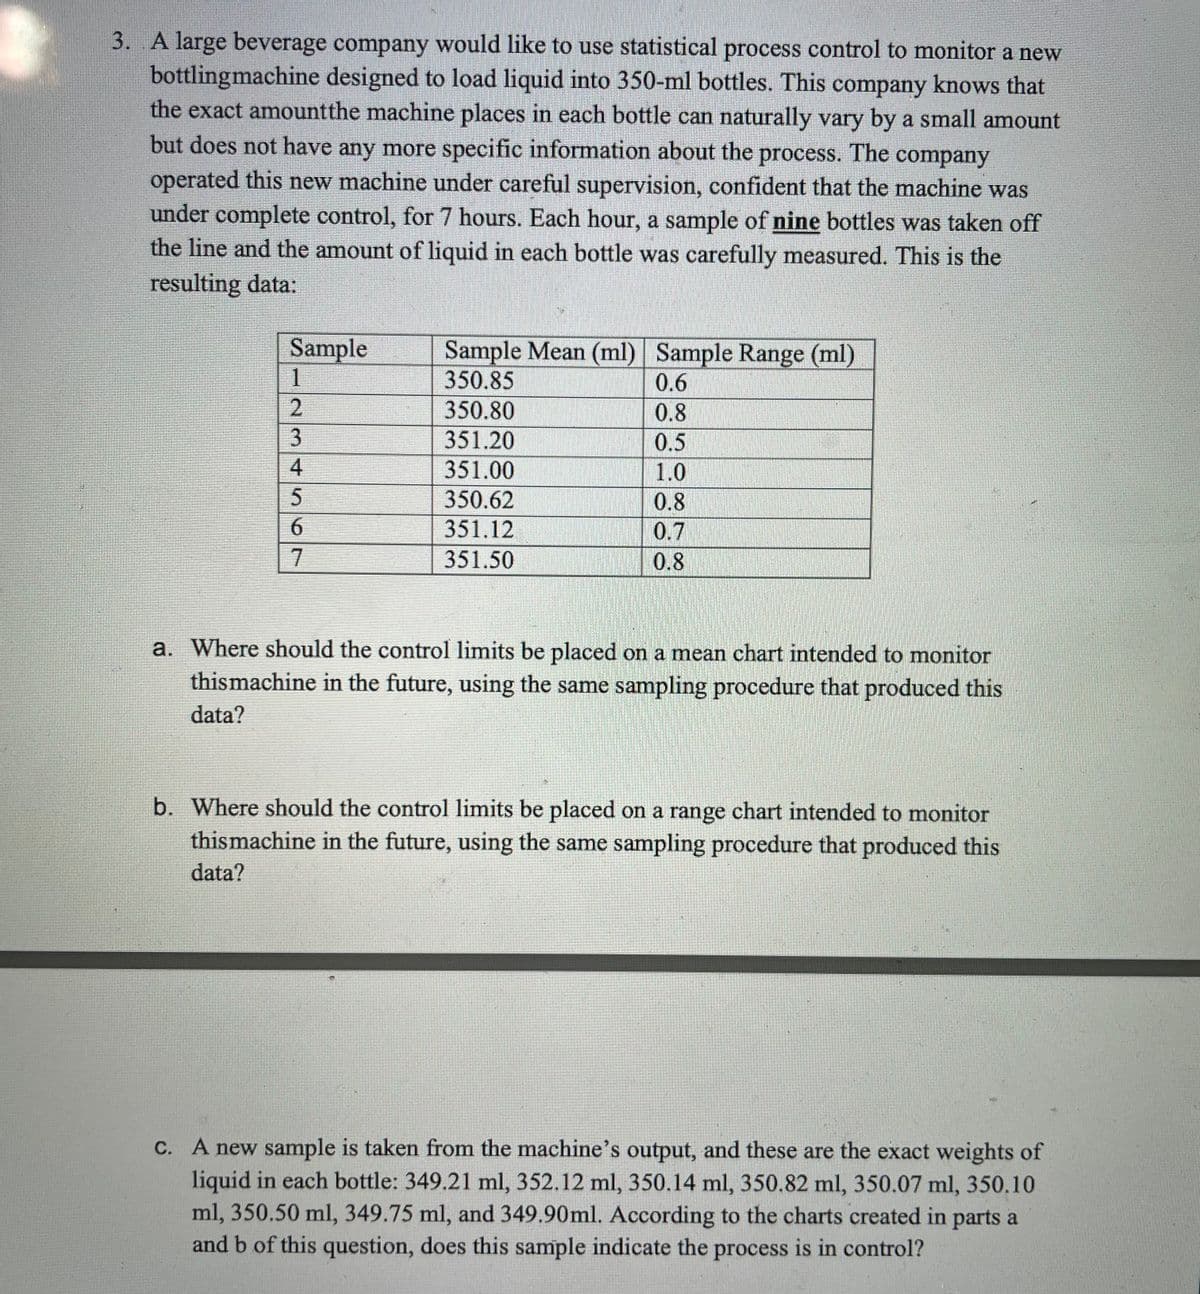
Transcribed Image Text:3. A large beverage company would like to use statistical process control to monitor a new
bottlingmachine designed to load liquid into 350-ml bottles. This company knows that
the exact amountthe machine places in each bottle can naturally vary by a small amount
but does not have any more specific information about the process. The company
operated this new machine under careful supervision, confident that the machine was
under complete control, for 7 hours. Each hour, a sample of nine bottles was taken off
the line and the amount of liquid in each bottle was carefully measured. This is the
resulting data:
Sample
Sample Mean (ml) Sample Range (ml)
350.85
0.6
350.80
0.8
0.5
351.20
351.00
1.0
350.62
0.8
351.12
0.7
0.8
351.50
a. Where should the control limits be placed on a mean chart intended to monitor
thismachine in the future, using the same sampling procedure that produced this
data?
b. Where should the control limits be placed on a range chart intended to monitor
thismachine in the future, using the same sampling procedure that produced this
data?
C. A new sample is taken from the machine's output, and these are the exact weights of
liquid in each bottle: 349.21 ml, 352.12 ml, 350.14 ml, 350.82 ml, 350.07 ml, 350.10
ml, 350.50 ml, 349.75 ml, and 349.90ml. According to the charts created in parts a
and b of this question, does this sample indicate the process is in control?
123 4567
Expert Solution
This question has been solved!
Explore an expertly crafted, step-by-step solution for a thorough understanding of key concepts.

This is a popular solution!

Trending now
This is a popular solution!

Step by step
Solved in 4 steps

Recommended textbooks for you
Practical Management Science
Operations Management
ISBN:
9781337406659
Author:
WINSTON, Wayne L.
Publisher:
Cengage,

Operations Management
Operations Management
ISBN:
9781259667473
Author:
William J Stevenson
Publisher:
McGraw-Hill Education

Operations and Supply Chain Management (Mcgraw-hi…
Operations Management
ISBN:
9781259666100
Author:
F. Robert Jacobs, Richard B Chase
Publisher:
McGraw-Hill Education
Practical Management Science
Operations Management
ISBN:
9781337406659
Author:
WINSTON, Wayne L.
Publisher:
Cengage,
Operations Management
Operations Management
ISBN:
9781259667473
Author:
William J Stevenson
Publisher:
McGraw-Hill Education
Operations and Supply Chain Management (Mcgraw-hi…
Operations Management
ISBN:
9781259666100
Author:
F. Robert Jacobs, Richard B Chase
Publisher:
McGraw-Hill Education


Purchasing and Supply Chain Management
Operations Management
ISBN:
9781285869681
Author:
Robert M. Monczka, Robert B. Handfield, Larry C. Giunipero, James L. Patterson
Publisher:
Cengage Learning

Production and Operations Analysis, Seventh Editi…
Operations Management
ISBN:
9781478623069
Author:
Steven Nahmias, Tava Lennon Olsen
Publisher:
Waveland Press, Inc.