C. The following table summarizes the grade point averages (GPAS) of graduale students in a statistics class. Approximate the mean GPA of the class. GPA Frequency 3.0-under 3.2 3.2-under 3.4 6. 3.4-under 3.6 6. 3.6-under 3.8 16 3.8-4.0
C. The following table summarizes the grade point averages (GPAS) of graduale students in a statistics class. Approximate the mean GPA of the class. GPA Frequency 3.0-under 3.2 3.2-under 3.4 6. 3.4-under 3.6 6. 3.6-under 3.8 16 3.8-4.0

Glencoe Algebra 1, Student Edition, 9780079039897, 0079039898, 2018
18th Edition
ISBN:9780079039897
Author:Carter
Publisher:Carter
Chapter10: Statistics
Section10.4: Distributions Of Data
Problem 19PFA

Related questions
Question
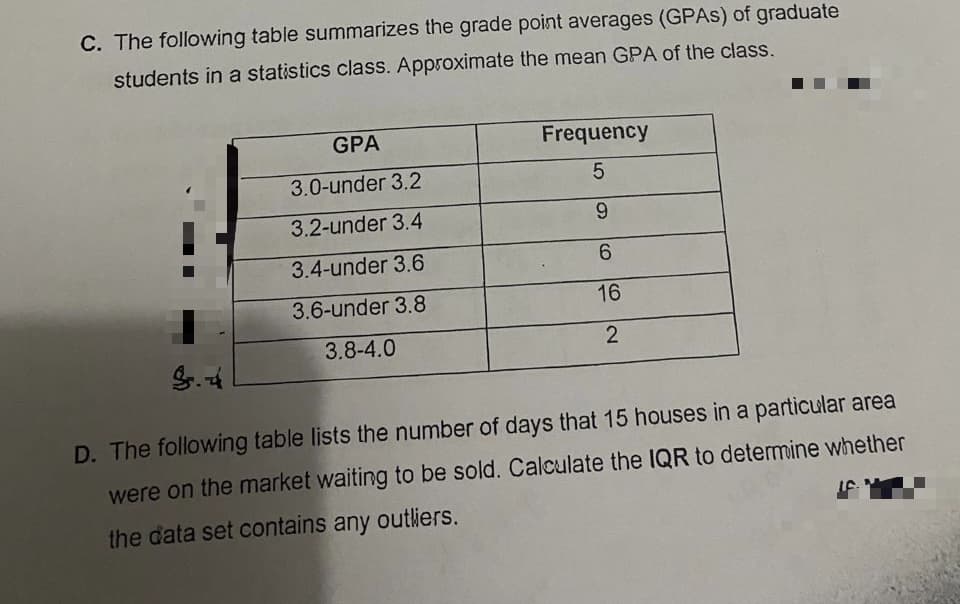
Transcribed Image Text:C. The following table summarizes the grade point averages (GPAS) of graduate
students in a statistics class. Approximate the mean GPA of the class.
GPA
Frequency
3.0-under 3.2
3.2-under 3.4
6.
3.4-under 3.6
6.
3.6-under 3.8
16
3.8-4.0
D. The following table lists the number of days that 15 houses in a particular area
were on the market waiting to be sold. Calculate the IQR to determine whether
the data set contains any outliers.
Expert Solution
This question has been solved!
Explore an expertly crafted, step-by-step solution for a thorough understanding of key concepts.

Step by step
Solved in 2 steps with 2 images

Recommended textbooks for you
Glencoe Algebra 1, Student Edition, 9780079039897…
Algebra
ISBN:
9780079039897
Author:
Carter
Publisher:
McGraw Hill
Glencoe Algebra 1, Student Edition, 9780079039897…
Algebra
ISBN:
9780079039897
Author:
Carter
Publisher:
McGraw Hill