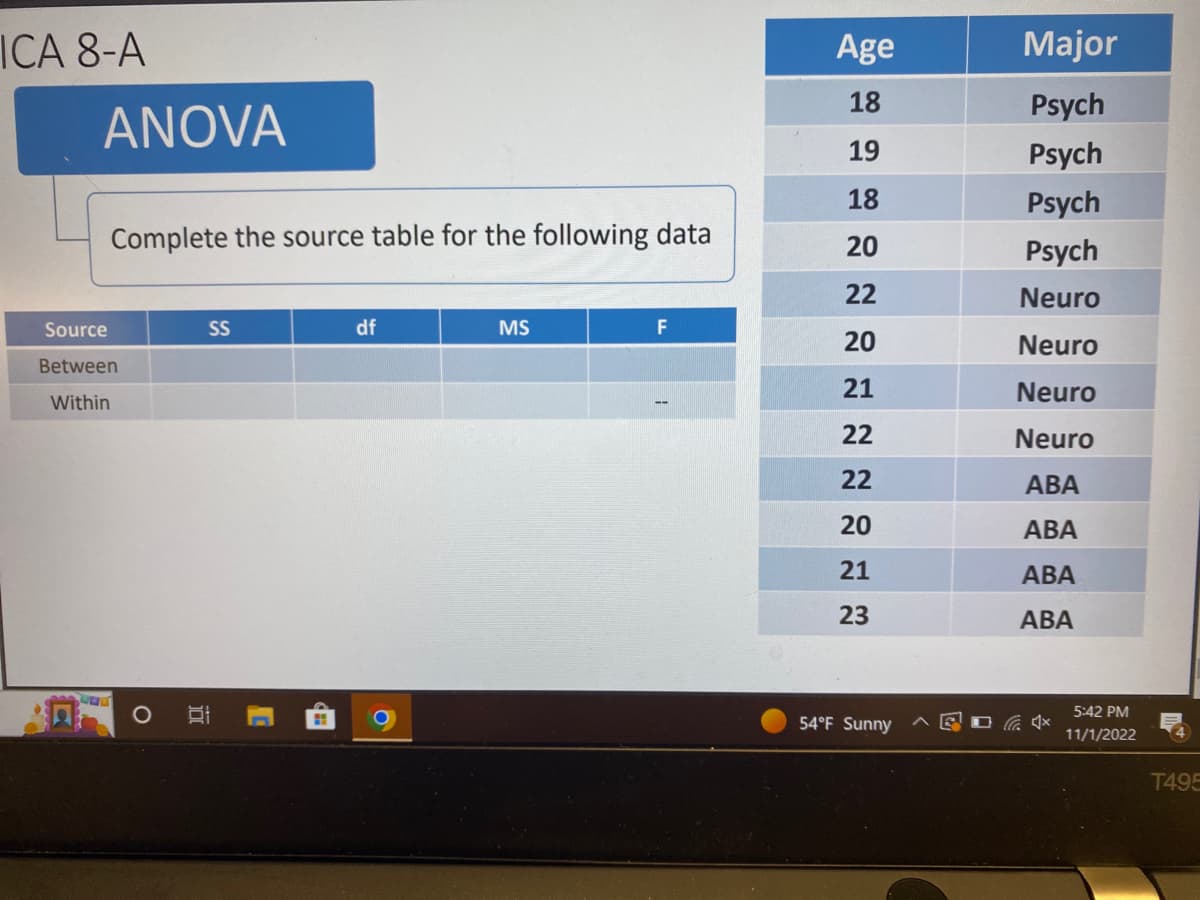
CA 8-A ANOVA Complete the source table for the following data Source Between Within O D SS df O MS F Age 18 19 18 20 22 20 21 22 22 20 21 23 54°F Sunny Major Psych Psych Psych Psych Neuro Neuro Neuro Neuro ABA ABA ABA ABA 5:42 PM 11/1/2022 T495


Q: O O Price ($) Age (years) 350 300 250 200 150 100 50 0 50 40 30 20 10 0 0 0 50 10 100 20 8 30 Age…
A: It is given that Independent variable (X) = Age( years ) The independent variable is on x-axis.…
Q: A. z = -2.49. Answer: 0.2779 B. z = 2.56. Answer: Round to 4 decimal places. Round to 4 decimal…
A: It is given that the standard normal random distribution.
Q: A store owner of headache medicine claims it is 60% effective within a few minutes. That is, out of…
A: Given, let 'X' be the number of patients having relief within a few minutes out of 12 patients.…
Q: 2009 Irmation Administration (US EIA) reported that the average price for a gallen of regular…
A: Average = 2.94 S = 0.20 Confidence level = 95%
Q: A Human Resource director of a large company wants to investigate if professional staff takes longer…
A: Note: Hi, there! Since there are more than 3 sub parts, we are answering the first 3 sub-parts.…
Q: When two fair, six-sided number cubes are used, the probability of rolling doubles is 1/6. Suppose…
A: Given n=3 P=1/6
Q: 2. Listed below are 15 Los Angeles commute times. Construct a 90% confidence interval estimate of…
A: 2)
Q: 2.38 Baggage fees: An airtine charges the following baggage fees: $20 for the first bag and $35 for…
A: Formula Used: The expected value is = E(X) E(X) = ∑xP(x) Standard deviation = E(X2)-E(X)2
Q: Assume that adults have IQ scores that are normally distributed with a mean of 100.4 and a standard…
A: Given mean=100.4, standard deviations=24.8
Q: A consumer products testing group is evaluating two competing brands of tires, Brand 1 and Brand 2.…
A: Given that: Car Brand 1 Brand 2 Difference (Brand 1 - Brand 2) 1 0.35 0.45 -0.10 2 0.54…
Q: While reading a published research report, you encounter the following statements. For each,…
A: Statement (a): When we examined the perceptual skills data, the mean of 55 for the sample of…
Q: Use n = 6 and p = 0.4 to complete parts (a) through (d) below. XO P(x) 0 1 2 3 4 5 6 (Round to four…
A:
Q: The data below shows car model and the color of vehicles sold at a Car dealership. Hyundai Honda…
A: “Since you have posted a question with multiple sub-parts, we will solve first three sub-parts for…
Q: You want to create a password for a certain application subject to the following requirements. The…
A: 26 ways to fill it 25 ways to fill it 24 ways to fill it 23 ways to fill it 22 ways to fill it 10…
Q: Observation x y 1 -22 22 2 -33 49 3 2 8 4 29 -16 5 -13 10 6 21 -28 7 -13 27 8 -23 35 9 14 -5 10 3 -3…
A: a) The scatter plot can be obtained using EXCEL software. Enter the values of X in column A and Y…
Q: Which of the following can be represented by a discrete random variable? Multiple Choice The…
A: Discrete random variables : It can take only countable number of distinct values : As : 0,1,2,3....…
Q: Step 2 of 6: Find the estimated y-intercept. Round your answer to three decimal places. Answer How…
A: It is given that the two random variables number of tickets (X) and GPA (Y). The regression equation…
Q: A population of values has a normal distribution with = 75.3 and o = 91.6. You intend to draw a…
A: given data normal distribution μ = 75.3σ = 91.6n = 109
Q: In a study of 2000 model cars, a researcher computed the least-squares regression line of price (in…
A: Equation is given : Price = -700 + 170* horse power
Q: (b) Use rules of variance to obtain an expression for the variance and standard deviation (standard…
A: It is given that X1, X2, …, Xm denotes the beam strengths with mean, μ1 and standard deviation, σ1,…
Q: 68. Household Incomes. The following data represent a sample of 14 household incomes ($1000s).…
A: Data given : 49.4,52.4,53.4,51.3,52.1,48.7,52.1,52.2,64.5,51.6,46.5,52.9,52.5,51.2 Arrange the data…
Q: The random variable x represents the number of boys in a family of three children. Assuming that…
A: Answer; - Given a probability distribution x P(x) x*P(x) x^2*P(x) 0 0.125 0 0…
Q: Die A has 4 red and 2 white faces, whereas die B has 2 red and 4 white faces. A coin is flipped…
A: Given that: Die A: It contains 4 red and 2 white faces. Die B: It contains 2 red and 4 white faces.…
Q: Find P(-1.77 < Z ≤ 2.32) where Z is the standard normal random variable.
A: It is given that the Z be a standard normal random variable.
Q: Team A and Team B are scheduled to play each other 10 times this season. If each game is played…
A: It is given that P( team A beat team B ), p = 38% = 0.38 q = 1 - p = 0.62
Q: An online used car company sells second-hand cars. For 30 randomly selected transactions, the mean…
A: From the provided information, Population standard deviation (σ) = 200 Sample mean (x̄) = 2500…
Q: The mean of the values 2, 3, 4, 6, 9, 10, rounded appropriately, is: da 8.67 Ob.8.666666667 0087 Od…
A: Given values is 2,3,4,6,9,10
Q: In order to estimate the av sample of 100 students yie Math scores in that state is Construct a 95%…
A: Note: “Since you have posted a question with multiple sub-parts, we will solve the first three…
Q: The mean of the values 2, 3, 4, 6, 9, 10, rounded appropriately, is: 8.67 Ob 8.666666667 087…
A: Data given 2,3,4,6,9,10 n=6
Q: I think it’s c, please check if correct. Also having trouble with question 2 : How many bacteria…
A: Solution: The table of bacteria is Trait Red Pink White Row Total Antibiotic Resistant 21…
Q: Out of 600 people sampled, 486 had kids. Based on this, construct a 95% confidence interval for the…
A: It is given that Favourable cases, X = 486 Sample size, n = 600
Q: 2. The random variables X and Y have joint density p(x, y) = = {cry Jcry(1-x) if 0<x< 1, 0<y<1,…
A: Since you have posted a question with multiple subparts, we will solve first three subparts for you.…
Q: People who diet can expect to lose an average of 3kg in a month. In a book, the authors claim that…
A: given dataclaim: people who follow a new diet will lose an average of less than 3kg in a month.…
Q: There are nine flights from Minneapolis to St. Cloud each day. The probability that any one flight…
A:
Q: year-old female opose a life insurance company sells a $300,000 1-year term life insurance policy to…
A: Given We have been given that the insurance company wants to sell a term life insurance policy to a…
Q: An opaque bag contains 28 yellow marbles and 11 teal marbles. If two marbles are randomly chosen…
A: given data,28-yellow marbles 11-teal marbles 39- total marbles here two marbles are randomly chosen…
Q: Let Z be a random variable whose outcomes follow a standard normal distribution. Recall that a…
A: given data standard normal distribution Z~N(0,1) μ = 0σ = 1 P(-1.87<z<-0.91) = ?
Q: A study was recently conducted to assess the relationship between miscarriage and heavy alcohol use…
A: Given that: Total number of women who suffered miscarriage = 50 Total number of women who delivered…
Q: In one Introductory Statistics class, the probability that a student will pass the first test is…
A: events: A: pass first test B: pass second test P(A) = 0.55 P(A') = 1 - 0.55 = 0.45 P(B|A)…
Q: Distribution with N(3.39, 0.55) with numbers being in kg (kilograms) D. Compute P(birth weight > 4…
A:
Q: Consider a Normal Distribution of Mean = 50 and Standard Deviation of 10. D. Approximate the value…
A: Given Mean(μ)=50standard deviation(σ)=10
Q: Determine the minimum required sample size if you want to be 95% confident that the sample mean is…
A: Given Margin of error=1 C=95% confident level σ = 4.8. the population is normally distributed
Q: C... c. When redesigning the ejection seat, which probability is more relevant? OA. Part (b) because…
A: given data,normal distribution μ=159σ=30.6we have to find out the given probabilty
Q: A box contains 13 identical cards, 7 of the cards are blue and the rest are red. Two cards are…
A: GivenNo.of blue cards=7No.of red cards=6Total no.of cards=13
Q: Letting y represent amount of carbon monoxide and letting x represent amount of tar, find the…
A: Note: As per the guidelines only one question can be answered. Kindly, resubmit for other question.
Q: ccording to flightstats.com, American Airlines flights from Dallas to Chicago are on time 80% of the…
A: Given that Number of trials =20 Probability of success =0.80 X~binomial(n,p) nCx=n!/(n-x)!x! NOTE:-…
Q: A random sample of 25 night students was taken with a sample mean GPA of 2.86 and a standard…
A: The summary of the statistics is,
Q: A variable of a population has a mean of μ=100 and a standard deviation of σ=27 The sampling…
A:
Q: A survey of 30 r/s students in a large college indicated that 19 of them held off-campus jobs. Does…
A: It is given that a survey of 30 randomly selected students in a large college indicated that 19 of…
Q: Aspirin tablets are sold with the label “active ingredient: aspirin 325 mg.” It is also known that…
A: The question is about hypo. testing Given : Popl. avg. amount of aspirin ( μ ) = 325 mg Popl. std.…

Step by step
Solved in 3 steps

- How long does it take to finish the 1161-mile Iditarod Dog Sled Race from Anchorage to Nome, Alaska? Finish times (to the nearest hour) for 27 dogsled teams are shown below. 283 304 305 288 290 288 289 297 299 332 330 309 328 307 328 285 291 295 298 306 315 310 318 318 320 333 321 Make a dotplot for the data above regarding the finish time (number of hours) for the Iditarod Dog Sled Race. Select the appropriate dotplot below.A lecturer at college wanted to know if he can predict student’s quiz results by asking them tocomplete a simple survey. The result of the survey is given below: Quiz Results EQR Study Hrs Age Sex BBT MB MC AuHS LM 15 10 3 19 0 0 1 1 0 1 14 15 4 24 0 0 1 0 0 1 9 15 1 20 0 10 1 0 0 1 6 10 3 21 0 0 1 1 0 1 14 15 4 21 0 9 1 0 0 1 12 10 6 21 0 2 0 1 0 1 12 13 2 21 1 8 1 0 0 0 15 15 0 20 0 8 1 0 0 1 12 15 3 20 0 10 1 0 0 1 13 15 0.2 19 0 8 1 0 0 1 15 15 2 20 0 6 1 0 1 1 12 14 5 20 0 5 1 1 1 1 14 15 7 22 0 8 0 0 0 0 7 7 10 21 1 7 0 0 1 0 11 15 5 24 0 0 1 0 0 1 10 10 3 22 1 0 1 0 0 1 13 11 3 23 1 1 1 1 1 1 13 15 2 22 1 8 0 0 0 0 13 12 4 20 1 7 1 0 1 0 13 10 3 20 1 0 1 0 0 1 8 13 5 20 1 8 0 0 0 0 12 13 5 22 0 5 0 0 0 1 13 15 8 22 0 5 0 1 0 1 10 13 4 23 1 7 1 0 0 1 13 13 0.5 20 1 0 0 0 0 0 12 13 0.5 20 1 0 1 0 0 0 15 15 2 21 0 10 1 0 0 1 10 13 6 22 0 6 1 1 0 1 11 8 5 20 0 10 0 0 1 0 12 10 4 19 1 0 1 0 0 1 8 5 2 20 1 0 1 0 1 0 11…A lecturer at college wanted to know if he can predict student’s quiz results by asking them tocomplete a simple survey. The result of the survey is given below: Quiz Results EQR Study Hrs Age Sex BBT MB MC AuHS LM 15 10 3 19 0 0 1 1 0 1 14 15 4 24 0 0 1 0 0 1 9 15 1 20 0 10 1 0 0 1 6 10 3 21 0 0 1 1 0 1 14 15 4 21 0 9 1 0 0 1 12 10 6 21 0 2 0 1 0 1 12 13 2 21 1 8 1 0 0 0 15 15 0 20 0 8 1 0 0 1 12 15 3 20 0 10 1 0 0 1 13 15 0.2 19 0 8 1 0 0 1 15 15 2 20 0 6 1 0 1 1 12 14 5 20 0 5 1 1 1 1 14 15 7 22 0 8 0 0 0 0 7 7 10 21 1 7 0 0 1 0 11 15 5 24 0 0 1 0 0 1 10 10 3 22 1 0 1 0 0 1 13 11 3 23 1 1 1 1 1 1 13 15 2 22 1 8 0 0 0 0 13 12 4 20 1 7 1 0 1 0 13 10 3 20 1 0 1 0 0 1 8 13 5 20 1 8 0 0 0 0 12 13 5 22 0 5 0 0 0 1 13 15 8 22 0 5 0 1 0 1 10 13 4 23 1 7 1 0 0 1 13 13 0.5 20 1 0 0 0 0 0 12 13 0.5 20 1 0 1 0 0 0 15 15 2 21 0 10 1 0 0 1 10 13 6 22 0 6 1 1 0 1 11 8 5 20 0 10 0 0 1 0 12 10 4 19 1 0 1 0 0 1 8 5 2 20 1 0 1 0 1 0 11…
- A lecturer at college wanted to know if he can predict student’s quiz results by asking them tocomplete a simple survey. The result of the survey is given below: Quiz Results EQR Study Hrs Age Sex BBT MB MC AuHS LM 15 10 3 19 0 0 1 1 0 1 14 15 4 24 0 0 1 0 0 1 9 15 1 20 0 10 1 0 0 1 6 10 3 21 0 0 1 1 0 1 14 15 4 21 0 9 1 0 0 1 12 10 6 21 0 2 0 1 0 1 12 13 2 21 1 8 1 0 0 0 15 15 0 20 0 8 1 0 0 1 12 15 3 20 0 10 1 0 0 1 13 15 0.2 19 0 8 1 0 0 1 15 15 2 20 0 6 1 0 1 1 12 14 5 20 0 5 1 1 1 1 14 15 7 22 0 8 0 0 0 0 7 7 10 21 1 7 0 0 1 0 11 15 5 24 0 0 1 0 0 1 10 10 3 22 1 0 1 0 0 1 13 11 3 23 1 1 1 1 1 1 13 15 2 22 1 8 0 0 0 0 13 12 4 20 1 7 1 0 1 0 13 10 3 20 1 0 1 0 0 1 8 13 5 20 1 8 0 0 0 0 12 13 5 22 0 5 0 0 0 1 13 15 8 22 0 5 0 1 0 1 10 13 4 23 1 7 1 0 0 1 13 13 0.5 20 1 0 0 0 0 0 12 13 0.5 20 1 0 1 0 0 0 15 15 2 21 0 10 1 0 0 1 10 13 6 22 0 6 1 1 0 1 11 8 5 20 0 10 0 0 1 0 12 10 4 19 1 0 1 0 0 1 8 5 2 20 1 0 1 0 1 0 11…A lecturer at college wanted to know if he can predict student’s quiz results by asking them tocomplete a simple survey. The result of the survey is given below: Quiz Results EQR Study Hrs Age Sex BBT MB MC AuHS LM 15 10 3 19 0 0 1 1 0 1 14 15 4 24 0 0 1 0 0 1 9 15 1 20 0 10 1 0 0 1 6 10 3 21 0 0 1 1 0 1 14 15 4 21 0 9 1 0 0 1 12 10 6 21 0 2 0 1 0 1 12 13 2 21 1 8 1 0 0 0 15 15 0 20 0 8 1 0 0 1 12 15 3 20 0 10 1 0 0 1 13 15 0.2 19 0 8 1 0 0 1 15 15 2 20 0 6 1 0 1 1 12 14 5 20 0 5 1 1 1 1 14 15 7 22 0 8 0 0 0 0 7 7 10 21 1 7 0 0 1 0 11 15 5 24 0 0 1 0 0 1 10 10 3 22 1 0 1 0 0 1 13 11 3 23 1 1 1 1 1 1 13 15 2 22 1 8 0 0 0 0 13 12 4 20 1 7 1 0 1 0 13 10 3 20 1 0 1 0 0 1 8 13 5 20 1 8 0 0 0 0 12 13 5 22 0 5 0 0 0 1 13 15 8 22 0 5 0 1 0 1 10 13 4 23 1 7 1 0 0 1 13 13 0.5 20 1 0 0 0 0 0 12 13 0.5 20 1 0 1 0 0 0 15 15 2 21 0 10 1 0 0 1 10 13 6 22 0 6 1 1 0 1 11 8 5 20 0 10 0 0 1 0 12 10 4 19 1 0 1 0 0 1 8 5 2 20 1 0 1 0 1 0 11…Which of these four forecasts seems to have the most bias? A. (6,4,3,2) B. 3-period moving average C. Alpha = .3D. Simple moving average
- 1. Draw a scatterplot for these data and calculate the coefficients of determination.Need help! Will give thumbs up! Thank you. Data is given below. TSERofReturn AcmeRofReturn -1.99167 -1.03712 2.64815 3.04528 -0.58856 0.44802 -0.76395 0.60781 -0.81178 2.51735 -0.14212 1.70972 0.17677 -0.27609 0.54349 1.18672 -0.09428 0.49632 0.3681 -3.08347 0.60727 1.4182 1.3726 0.1878 -0.8915 -1.81699 1.8031 0.975 -0.26967 1.85853 2.42493 2.33005 -0.95528 -0.48742 -0.28562 -0.15591 -2.13517 -1.67924 -0.85961 1.57905 1.0856 -4.09194 -1.06689 -0.43368 0.04922 1.22281 3.2381 -0.55675 1.05371 -0.23124 -1.1785 -5.10525 1.11749 0.5909 -0.01456 1.70857 1.13344 0.93883 2.6641 0.92507 -1.33795 0.9294 -1.65683 -1.93668 -2.21489 -5.10648 -1.19445 0.47456 -0.461 0.19373 0.6551 -0.44915 1.5161 -1.11084 3.42943 2.58471 -0.3175 1.17337 -0.47695 -1.08238…Here's the dataset: Golfer Distance Accuracy Index Woods 316.1 54.6 3.58 Perry 304.7 63.4 3.48 Gutschewski 310.5 57.9 3.27 Wetterich 311.7 56.6 3.18 Hearn 295.2 68.5 2.82 Gronberg 301.4 63.2 2.74 Frazar 301 63.5 2.74 Warren 299.2 64.2 2.55 Glover 302.2 60.7 2.27 MacKenzie 300.2 62.1 2.22 Love III 305.4 57.9 2.21 Garcia 303.5 59.4 2.21 Durant 289.2 70.9 2.2 O'Hair 300.1 61.4 2.02 Singh 301.1 60.2 1.92 Long 298.3 62.4 1.9 Smith 300.8 60.2 1.85 Hend 318.9 45.4 1.89 Hughes 291.3 67.5 1.76 Stadler 300.1 60.4 1.76 Allenby 297.7 62.3 1.75 Mayfair 288.2 69.8 1.71 Appleby 300.6 59.3 1.58 Snyder III 291.8 66.3 1.56 Purdy 295.2 63.4 1.52 Brigman 295.5 63.1 1.5 Bryant 283.2 73 1.49 Rollins 294.4 63.7 1.43 Jobe 302.3 57.3 1.42 Brehaut 286.6 69.9 1.4 Ogilvy 298 60.7 1.4 Henry 297.6 61 1.4 Rose 294.1 63.7 1.37 Westwood 296.8 61.5 1.36 Johnson 290 66.9 1.34 Senden 291 66 1.31 Mickelson 300 58.7 1.3 Watney 298.9 59.4 1.26…
- Question Two A Deputy Registrar at a certainty university conducted a Chi-Square test of association to establish whether or not employee grade and level of absenteeism were associated. Table 2 below shows part of the results which were obtained. Table 2: Cross tabulation of employee grade and level of absenteeism Contingency Tables Grade LAbsence 1 2 3 Total low Observed 8 1 0 9 Expected 2.90 3.48 2.61 9.00 high Observed 2 11 9 22 Expected 7.10 8.52 6.39 22.00 Total Observed 10 12 9 31 Expected 10.00 12.00 9.00 31.00 2.1 State the appropriate measurement scales for the variables. 2.2 State the null and alternative hypotheses. 2.3 Calculate the expected frequency corresponding to a Grade 3 academic with a high level of absenteeism. 2.4 Find the Chi-Square critical value and test…Cell Phone Radiation Listed below are the measured radiation absorption rates (in W/kg) corresponding to these cell phones: iPhone 5S, BlackBerry Z30, Sanyo Vero, Optimus V, Droid Razr, Nokia N97, Samsung Vibrant, Sony Z750a, Kyocera Kona, LG G2, and Virgin Mobile Supreme. The data are from the Federal Communications Commission. If one of each model of cell phone is measured for radiation and the results are used to find the measures of variation, are the results typical of the population of cell phones that are in use?rofessor Cornish studied rainfall cycles and sunspot cycles. (Reference: Australian Journal of Physics, Vol. 7, pp. 334-346.) Part of the data include amount of rain (in mm) for 6-day intervals. The following data give rain amounts for consecutive 6-day intervals at Adelaide, South Australia. 7 28 7 1 69 3 1 4 22 7 16 4 54 160 60 73 27 3 3 1 7 144 107 4 91 44 1 8 4 22 4 59 116 52 4 155 42 24 11 43 3 24 19 74 26 63 110 39 34 71 52 39 8 0 15 2 14 9 1 2 4 9 6 10 (i) Find the median. (Use 1 decimal place.)(ii) Convert this sequence of numbers to a sequence of symbols A and B, where A indicates a value above the median and B a value below the median. Test the sequence for randomness about the median at the 5% level of significance. (b) Find the number of runs R, n1, and n2. Let n1 = number of values above the median and n2 = number of values below the median. R n1 n2 (c) In the case, n1 > 20, we cannot use Table 10 of Appendix II to find the critical…


