Čalcium level (kg/plot) Plot Preburn Postburn 50 9 50 18 82 45 64 18 82 18 73 9. 77 32 54 9 23 18 10 45 11 36 9 54 9 Construct a 95% confidence interval for the mean difference in calcium levels in the soil prior to and after the prescribed burn. Assume the distribution of differences in calcium levels to be approximately normal. 1 2 3 4567 89유 2
Čalcium level (kg/plot) Plot Preburn Postburn 50 9 50 18 82 45 64 18 82 18 73 9. 77 32 54 9 23 18 10 45 11 36 9 54 9 Construct a 95% confidence interval for the mean difference in calcium levels in the soil prior to and after the prescribed burn. Assume the distribution of differences in calcium levels to be approximately normal. 1 2 3 4567 89유 2

Chapter6: Systems Of Equations And Inequalities
Section: Chapter Questions
Problem 17PS: Cholesterol Cholesterol in human blood is necessary, but too much can lead to health problems. There...

Related questions
Question
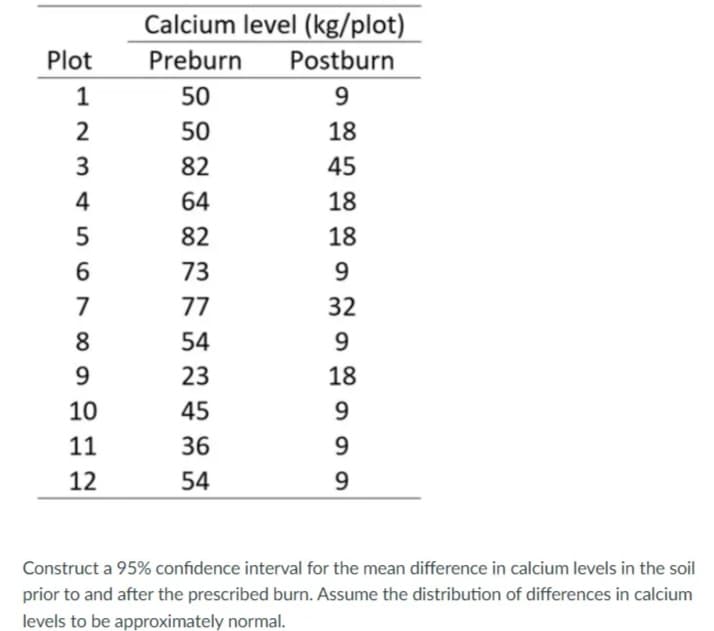
Transcribed Image Text:Calcium level (kg/plot)
Plot
Preburn
Postburn
1
50
9
50
18
3
82
45
4
64
18
82
18
6
73
9
7
77
32
8.
54
9.
9
23
18
10
45
9.
11
36
9
12
54
9.
Construct a 95% confidence interval for the mean difference in calcium levels in the soil
prior to and after the prescribed burn. Assume the distribution of differences in calcium
levels to be approximately normal.
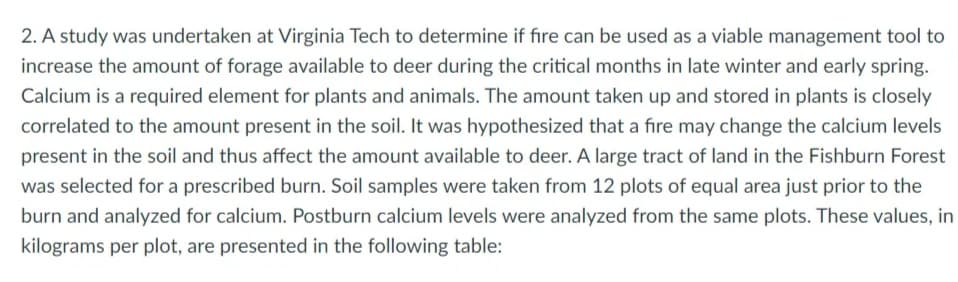
Transcribed Image Text:2. A study was undertaken at Virginia Tech to determine if fire can be used as a viable management tool to
increase the amount of forage available to deer during the critical months in late winter and early spring.
Calcium is a required element for plants and animals. The amount taken up and stored in plants is closely
correlated to the amount present in the soil. It was hypothesized that a fire may change the calcium levels
present in the soil and thus affect the amount available to deer. A large tract of land in the Fishburn Forest
was selected for a prescribed burn. Soil samples were taken from 12 plots of equal area just prior to the
burn and analyzed for calcium. Postburn calcium levels were analyzed from the same plots. These values, in
kilograms per plot, are presented in the following table:
Expert Solution
This question has been solved!
Explore an expertly crafted, step-by-step solution for a thorough understanding of key concepts.

Step by step
Solved in 4 steps

Recommended textbooks for you

Linear Algebra: A Modern Introduction
Algebra
ISBN:
9781285463247
Author:
David Poole
Publisher:
Cengage Learning
Linear Algebra: A Modern Introduction
Algebra
ISBN:
9781285463247
Author:
David Poole
Publisher:
Cengage Learning