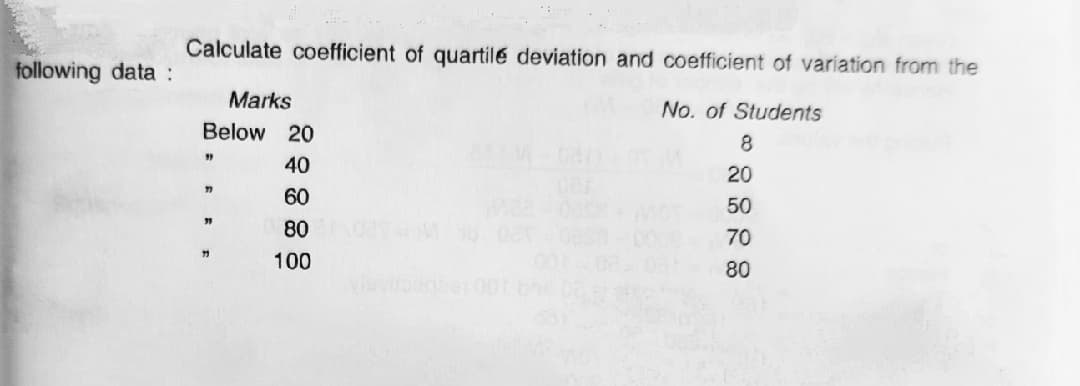
Calculate coefficient of quartile deviation and coefficient of variation from the following data : Marks No. of Students Below 20 8 40 20 77 60 50 80 70 100 80


Q: Calculate coefficient of quartile deviation and coefficient of variation from the following data…
A:
Q: . Calculate standard deviation and coefficient of variation from the data given below: Mid-points :…
A:
Q: The table below shows the total annual precipitation for San Diego, California. 2001 0 2001 2002…
A: Given: sample size(n)=10 Data: Year Precip(in) x 1994 9.4 1995 17 1996 7.3 1997 7 1998…
Q: Calculate the sample standard deviation of the data shown. Round to two decimal places. X 23 29 11…
A: Given data is x={23,29,11,13,28,22,27,25}sample size(n)=8
Q: 2. We are given data 124 ; 58 ; 215 ; 123 ; 79 ; 68 ; 82 ; 130 ; 128 ; 150 132 ; 69 ; 132 ; 115 ;…
A:
Q: The following data represents the age distribution of a sample of 100 people covered by Health…
A: Given: Age Number (f) 25-34 23 35-44 29 45-54 28 55-64 20
Q: 3. Find out the value of quartile deviation and its coefficient from the follev dadi. Roll No. 1 4…
A:
Q: Example 5. From the following data, calculate the quartile deviation and the coefficient quartile…
A:
Q: 3. The data on relative humidity (in %) for the first ten days of the month in a city are given…
A:
Q: Find out the value of quartile deviation and its coefficient from the following data. Weekly Income…
A:
Q: Most college career counselors agree that starting salary is associated with academic major. Even if…
A: The standardized measure of dispersion, which measures the relative variability is known as the…
Q: Find mean and standard deviation of the following data : Wages ()pol 20–30 30 40 40-50 50-60 70-80…
A: We have to find mean and standard deviation of the given data Wages 20-30 30-40 40-50 50-60 60-70…
Q: Find the mean, variance and standard deviation of the following data: X 19 20 21 22 23 P(X) 0.2 0.2…
A: The table shows the X values and its probabilities values.
Q: The systolic blood pressure of individuals is thought to be related to both age and weight. For a…
A: X1 X2 X3 132 52 173 143 59 184 153 67 194 162 73 211 154 64 196 168 74 220 137 54 188…
Q: The following data shows how many employees showed up to work every day for two weeks 12 18 09 16 11…
A: We have given that data I want to find interquartile mean and standard deviation. Interquartile…
Q: Determine the Mean, Range, Mean Deviation, Sample Variance, Sample Standard Deviation and…
A: To determine the mean, range, mean deviation, sample variance, sample standard deviation and…
Q: Find the value of quartile deviation and its coefficient from the following data. Farm 2 3 4 6. 7 8…
A: We want to find quartile deviation and Coefficient of quartile deviation.
Q: Listed below are the top 10 annual salaries (in millions of dollars) of TV personalities. Find the…
A: Range of the sample data is, Range=Maximum-Minimum =40-15.9 =24.1
Q: Calculate standard deviation and its coefficient of variation from the following data : Measurements…
A: Class Frequency (f) Mid value (x) f⋅x f⋅x2 0-5 4 2.5 10 25 5-10 1 7.5 7.5 56.25 10-15 10…
Q: Calculate the standard deviation and variance of the data shown, to two decimal places X. 20.7 28.5…
A: The given data is: x 20.7 28.5 20.9 2.8 12.5 13.7 27.8 The mean for the data (μ)…
Q: Calculate Standard deviation of the following data : No. of Employees : 10-19 20-29 30-39 40-49…
A: Given: No. of employees No of firms 10-19 6 20-29 11 30-39 14 40-49 6 50-59 3
Q: Determine the Mean, Range, Mean Deviation, Sample Variance, Sample Standard Deviation and…
A:
Q: Find the quartile deviation, percentile deviation and their coefficients from the following data :…
A:
Q: This data is from a sample. Calculate the mean, standard deviation, and coefficient of variation.…
A: Number of samples (n) = 7 X 16.2 33.3 15.4 25 32.4 20.5 31.6
Q: Q5 Calculate Quartile Deviation and its Coefficient from the following data Weight (in pounds) 120…
A:
Q: At a fishery, the largest catches in August were of blackfin tuna, sailfish, blue marlin, and king…
A: Given Blackfin tuna SD=2.61 Sailfish SD=4.61 Blue marlin SD=1.97 King mackerel SD=6.67
Q: Calculate the quartile deviation and its Coefficient from the following data. Class-Interval…
A: We have given that, Class interval frequency 10-15 3 15-20 4 20-25 2 25-30 3 30-35 4…
Q: The following data represent the difference in scores between the winning and losing teams in a…
A: (a) Mean The table of calculations is provided below; No. Point Difference Midpoint (x) Frequency…
Q: Find the quartile deviation and coefficient of quartile deviation from the following table.
A: quartile deviation Q.D = Q3-Q12coefficient of Q.D = Q3-Q1Q3+Q1 for marks arrange the…
Q: Following are the 2009 earnings (in thousands of dollars) before taxes for all six employer of a…
A:
Q: a) The following data shows how many employees showed up to work every day for two weeks 12 18 09 16…
A: Data 12,18,9,16,11,10,8,10,13,11,15,17,16,11 (i) IQR=Q3-Q1 (ii) mean (iii) sample standard…
Q: Example 2. Calculate the quartile deviation and co-efficient of quartile deviation from the…
A:
Q: Calculate the mean deviation from median and its coefficient of the following data: X : 0 1 2 3 4 5…
A:
Q: Compute cocfficient of quartile deviation from the following data: 50 Marks 10 40 80 30 15 20 No. of…
A: Given The data is as follows: Marks No. of students 10 4 20 7 30 15 40 8 50 7 80 2
Q: Calculate the mean, variance and standard deviation for the following frequency distribution, and…
A: Given data, Class Frequency (f) Mid Point (M) Mi *fi 100-200 38 150 150*38=5700 200-300 18…
Q: Which is the largest with regard to the following data set: the range or the standard deviation? 11…
A: We have given that, X :- 11, 11, 12, 12, 12, 12, 13, 15, 17, 22, 22, 22 Then, We will check which…
Q: (56. Calculate coefficient of quartile deviation and coefficient of variation from the foliowing…
A: We want to find coefficient of variation and Quartile deviation.
Q: / Example 11. Find the mean deviation from (i) mean and (ii) median for the following daia: Marks :…
A:
Q: Calculate range, quartile deviation and its co-efficient from the following statistical data: Weight…
A:
Q: Calculate the standard deviation of the data shown, to two decimal places 6.3 28.2 24.9 23.7 5.7 2.7…
A:
Q: The data below is the ages of a population of 30 residents at a condominium. 28 34…
A: The given data shows the ages of a population of 30 residents at a condominium. Let x be the ages of…
Q: Calculate Quartile Deviation and its Coefficient from the following data : Weight (in pounds) 120…
A:
Q: a) The following data shows how many employees showed up to work every day for two weeks 12 18 09 16…
A:
Q: he following are HDL levels measured in healthy females. 65 60 58 52 70…
A: Formula for sample standard deviation : s=∑( x - x¯ )2n-1 Where , x¯ is sample mean x¯ = ∑xn
Q: 2. Determine the Standard Deviation and Variance of the data set as shown and compare the results…
A:
Q: This data is from a sample. Calculate the mean, standard deviation, and variance. 10.5 22.7 40.4…
A: Given data,10.5, 22.7, 40.4, 31.9, 34.2, 17.1,39.6, 43.2Sample Mean x¯ = Sum of the observationsno…
Q: The wholesale price of a commodity for seven consecutive days in a month is as follows: Days…
A:
Q: Find the mean, variance, and standard deviation of the following sets of data. 1. 11 15 19 23 27 31…
A: Given two data sets and we have to find the mean, variance and standard deviation of the data sets.
Q: 3. The data on relative humidity (in %) for the first ten days of the month in a city are given…
A: Since you have asked multiple questions, we will solve the first question for you. If you want any…
Q: Example 5. Calculate Quartile Deviation and its Coefficient from the following data : Weight (in…
A: We have given that, The data set is, Weight (x) 120 122 124 126 130 140 150 160 Students (f)…

Step by step
Solved in 3 steps with 3 images
