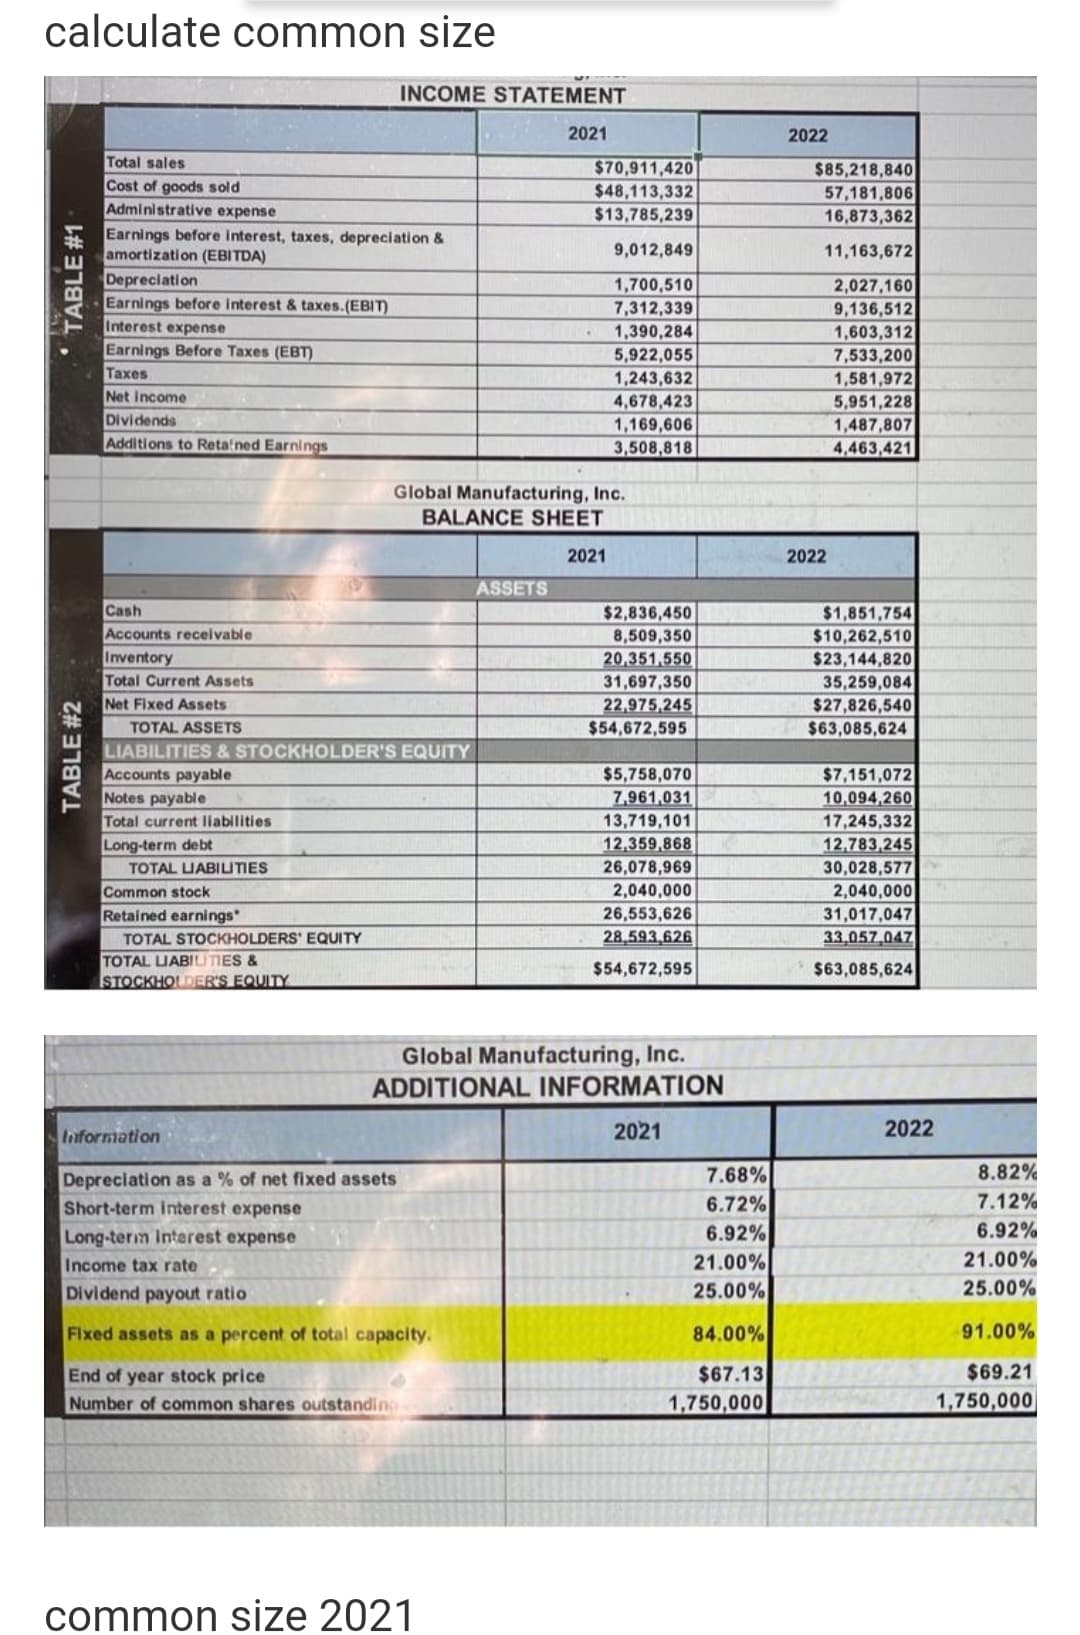
calculate common size INCOME STATEMENT 2021 2022 Total sales Cost of goods sold Administrative expense $70,911,420 $48,113,332 $13,785,239 $85,218,840 57,181,806 16,873,362 Earnings before interest, taxes, depreciation & amortization (EBITDA) 9,012,849 11,163,672 Depreciation Earnings before interest & taxes.(EBIT) Interest expense Earnings Before Taxes (EBT) 1,700,510 2,027,160 9,136,512 1,603,312 7,533,200 1,581,972 5,951,228 1,487,807 4,463,421 7,312,339 1,390,284 5,922,055 Taxes 1,243,632 4,678,423 1,169,606 3,508,818 Net Income Dividends Additions to Reta!ned Earnings Global Manufacturing, Inc. BALANCE SHEET 2021 2022 ASSETS Cash $1,851,754 $10,262,510 $23,144,820 35,259,084 $27,826,540 $2,836,450 Accounts recelvable Inventory Total Current Assets Net Fixed Assets 8,509,350 20,351,550 31,697,350 22,975,245 TOTAL ASSETS $54,672,595 $63,085,624 LIABILITIES & STOCKHOLDER'S EQUITY $7,151,072 10,094,260 17,245,332 12,783,245 30,028,577 2,040,000 31,017,047 33.057.047 Accounts payable Notes payable Total current liabilities $5,758,070 7,961,031 13,719,101 12,359,868 26,078,969 Long-term debt TOTAL UABIUTIES 2,040,000 Common Retained earnings 26,553,626 28.593 626 TOTAL STOCKHOLDERS' EQUITY TOTAL UABILUTIES & STOCKHOLDER'S EQUITY $54,672,595 $63,085,624 TABLE #1 TABLE #2
calculate common size INCOME STATEMENT 2021 2022 Total sales Cost of goods sold Administrative expense $70,911,420 $48,113,332 $13,785,239 $85,218,840 57,181,806 16,873,362 Earnings before interest, taxes, depreciation & amortization (EBITDA) 9,012,849 11,163,672 Depreciation Earnings before interest & taxes.(EBIT) Interest expense Earnings Before Taxes (EBT) 1,700,510 2,027,160 9,136,512 1,603,312 7,533,200 1,581,972 5,951,228 1,487,807 4,463,421 7,312,339 1,390,284 5,922,055 Taxes 1,243,632 4,678,423 1,169,606 3,508,818 Net Income Dividends Additions to Reta!ned Earnings Global Manufacturing, Inc. BALANCE SHEET 2021 2022 ASSETS Cash $1,851,754 $10,262,510 $23,144,820 35,259,084 $27,826,540 $2,836,450 Accounts recelvable Inventory Total Current Assets Net Fixed Assets 8,509,350 20,351,550 31,697,350 22,975,245 TOTAL ASSETS $54,672,595 $63,085,624 LIABILITIES & STOCKHOLDER'S EQUITY $7,151,072 10,094,260 17,245,332 12,783,245 30,028,577 2,040,000 31,017,047 33.057.047 Accounts payable Notes payable Total current liabilities $5,758,070 7,961,031 13,719,101 12,359,868 26,078,969 Long-term debt TOTAL UABIUTIES 2,040,000 Common Retained earnings 26,553,626 28.593 626 TOTAL STOCKHOLDERS' EQUITY TOTAL UABILUTIES & STOCKHOLDER'S EQUITY $54,672,595 $63,085,624 TABLE #1 TABLE #2
Fundamentals of Financial Management (MindTap Course List)
15th Edition
ISBN:9781337395250
Author:Eugene F. Brigham, Joel F. Houston
Publisher:Eugene F. Brigham, Joel F. Houston
Chapter4: Analysis Of Financial Statements
Section: Chapter Questions
Problem 24P: Income Statement for Year Ended December 31, 2018 (Millions of Dollars) Net sales 795.0 Cost of...
Related questions
Question

Transcribed Image Text:calculate common size
INCOME STATEMENT
2021
2022
Total sales
Cost of goods sold
Administrative expense
$70,911,420
$48,113,332
$13,785,239
$85,218,840
57,181,806
16,873,362
Earnings before interest, taxes, depreciation &
amortization (EBITDA)
Depreciation
Earnings before interest & taxes.(EBIT)
Interest expense
Earnings Before Taxes (EBT)
9,012,849
11,163,672
2,027,160
9,136,512
1,700,510
7,312,339
1,390,284
1,603,312
5,922,055
7,533,200
Taxes
Net Income
Dividends
Additions to Reta!ned Earnings
1,243,632
4,678,423
1,169,606
1,581,972
5,951,228
1,487,807
4,463,421
3,508,818
Global Manufacturing, Inc.
BALANCE SHEET
2021
2022
ASSETS
Cash
Accounts recelvable
Inventory
Total Current Assets
Net Fixed Assets
$2,836,450
8,509,350
20,351,550
$1,851,754
$10,262,510
$23,144,820
35,259,084
$27,826,540
$63,085,624
31,697,350
22,975,245
$54,672,595
TOTAL ASSETS
LIABILITIES & STOCKHOLDER'S EQUITY
$7,151,072
10,094,260
17,245,332
12,783,245
30,028,577
2,040,000
31,017,047
33,057.047
Accounts payable
Notes payable
$5,758,070
7,961,031
Total current liabilities
13,719,101
12,359,868
26,078,969
2,040,000
Long-term debt
TOTAL UABIITIES
Common stock
Retained earnings
26,553,626
TOTAL STOCKHOLDERS' EQUITY
28.593.626
TOTAL UABILÍTIES &
STOCKHOLDER'S EQUITY
$63,085,624
$54,672,595
Global Manufacturing, Inc.
ADDITIONAL INFORMATION
Information
2021
2022
8.82%
7.68%
6.72%
6.92%
21.00%
25.00%
Depreciation as a % of net fixed assets
Short-term interest expense
7.12%
Long-term Intarest expense
6.92%
Income tax rate
21.00%
Dividend payout ratio
25.00%
Fixed assets as a percent of total capacity.
84.00%
91.00%
End of year stock price
$67.13
$69.21
Number of common shares outstanding
1,750,000
1,750,000
common size 2021
TABLE #2
TABLE #1

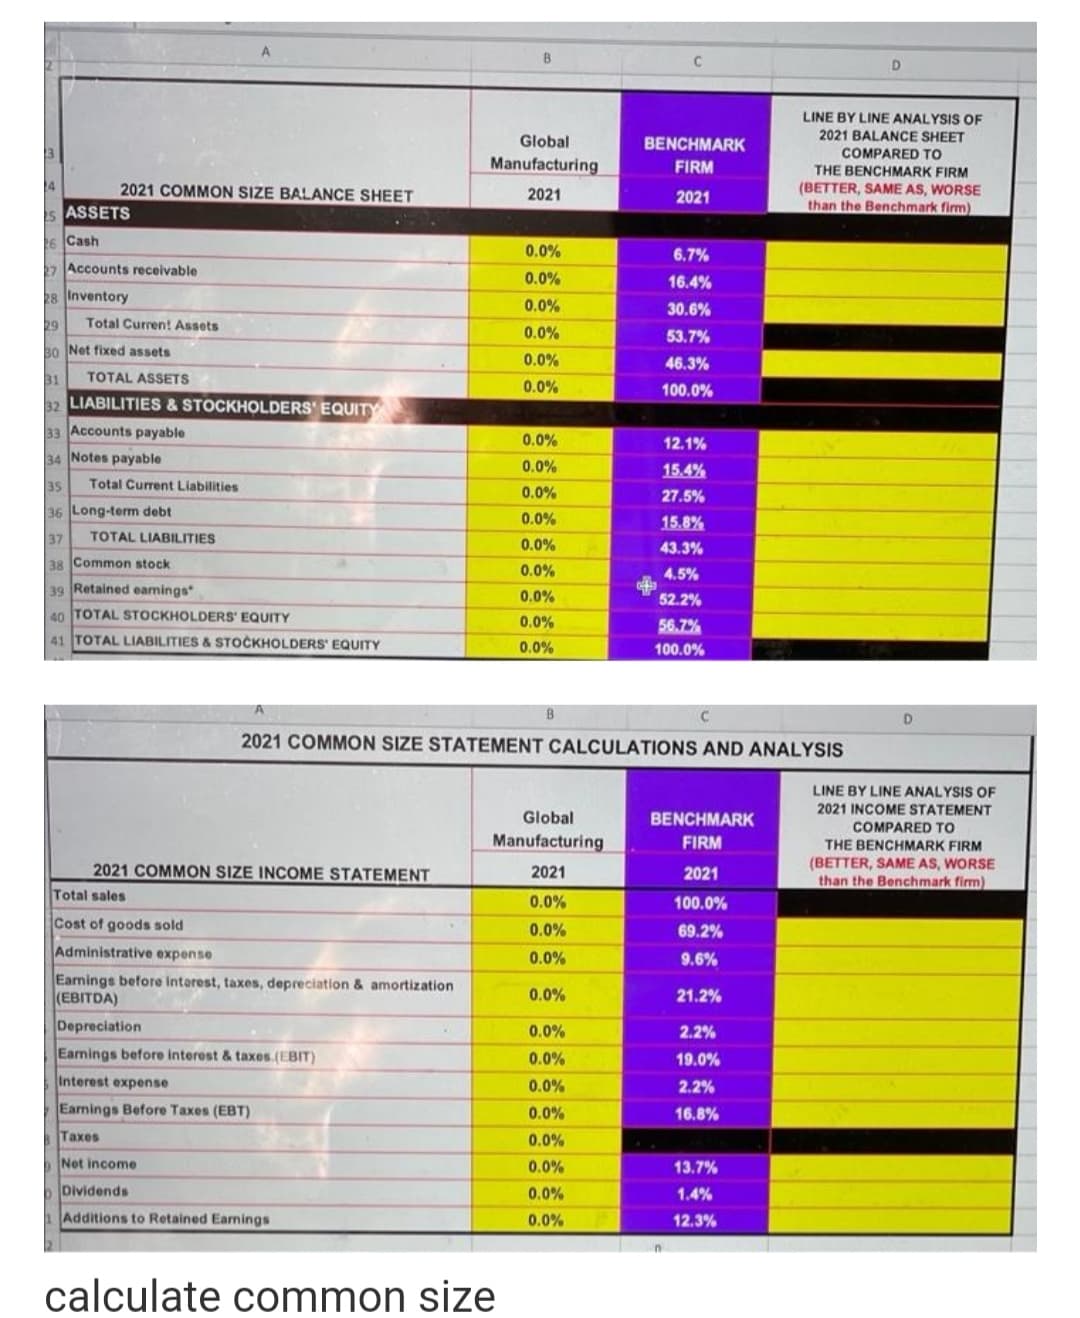
Transcribed Image Text:B
D
LINE BY LINE ANALYSIS OF
2021 BALANCE SHEET
COMPARED TO
Global
BENCHMARK
Manufacturing
FIRM
THE BENCHMARK FIRM
(BETTER, SAME AS, WORSE
than the Benchmark firm)
14
2021 COMMON SIZE BALANCE SHEET
2021
2021
s ASSETS
26 Cash
0.0%
6.7%
7 Accounts receivable
0.0%
16.4%
28 Inventory
0.0%
30.6%
29
Total Curren! Assets
0.0%
53.7%
30 Net fixed assets
0.0%
46.3%
31
TOTAL ASSETS
0.0%
100.0%
32 LIABILITIES & STOCKHOLDERS' EQUITY
33 Accounts payable
0.0%
12.1%
34 Notes payable
0.0%
15.4%
35
Total Current Liabilities
0.0%
27.5%
36 Long-term debt
0.0%
15.8%
37
TOTAL LIABILITIES
0.0%
43.3%
38 Common stock
0.0%
4.5%
39 Retained earnings
0.0%
52.2%
40 TOTAL STOCKHOLDERS' EQUITY
0.0%
56.7%
41 TOTAL LIABILITIES & STOČKHOLDERS' EQUITY
0.0%
100.0%
D
2021 COMMON SIZE STATEMENT CALCULATIONS AND ANALYSIS
LINE BY LINE ANALYSIS OF
2021 INCOME STATEMENT
Global
BENCHMARK
Manufacturing
COMPARED TO
THE BENCHMARK FIRM
FIRM
2021 COMMON SIZE INCOME STATEMENT
(BETTER, SAME AS, WORSE
than the Benchmark firm)
2021
2021
Total sales
0.0%
100.0%
Cost of goods sold
0.0%
69.2%
Administrative expense
0.0%
9.6%
Eamings before interest, taxes, depreciation & amortization
(EBITDA)
0.0%
21.2%
Depreciation
0.0%
2.2%
Earnings before interest & taxes.(EBIT)
0.0%
19.0%
Interest expense
0.0%
2.2%
Earnings Before Taxes (EBT)
0.0%
16.8%
Taxes
0.0%
Net income
0.0%
13.7%
Dividends
0.0%
1.4%
Additions to Retained Earnings
0.0%
12.3%
calculate common size
Expert Solution
This question has been solved!
Explore an expertly crafted, step-by-step solution for a thorough understanding of key concepts.
This is a popular solution!
Trending now
This is a popular solution!
Step by step
Solved in 2 steps

Follow-up Questions
Read through expert solutions to related follow-up questions below.
Follow-up Question
How should you compute the number that appears as "cost of good sold" in a common-size income statement?
Solution
Knowledge Booster
Learn more about
Need a deep-dive on the concept behind this application? Look no further. Learn more about this topic, accounting and related others by exploring similar questions and additional content below.Recommended textbooks for you

Fundamentals of Financial Management (MindTap Cou…
Finance
ISBN:
9781337395250
Author:
Eugene F. Brigham, Joel F. Houston
Publisher:
Cengage Learning

Fundamentals of Financial Management (MindTap Cou…
Finance
ISBN:
9781337395250
Author:
Eugene F. Brigham, Joel F. Houston
Publisher:
Cengage Learning