Calculate Hasbro's and UHS's ROE for each fiscal year. Verify if the answers below are correct if not, show the correct answer. 2019 2018 Hasbro's ROE: 17% 13% UHS ROE: 15% 15%
Calculate Hasbro's and UHS's ROE for each fiscal year. Verify if the answers below are correct if not, show the correct answer. 2019 2018 Hasbro's ROE: 17% 13% UHS ROE: 15% 15%

Intermediate Accounting: Reporting And Analysis
3rd Edition
ISBN:9781337788281
Author:James M. Wahlen, Jefferson P. Jones, Donald Pagach
Publisher:James M. Wahlen, Jefferson P. Jones, Donald Pagach
Chapter21: The Statement Of Cash Flows
Section: Chapter Questions
Problem 7C

Related questions
Question
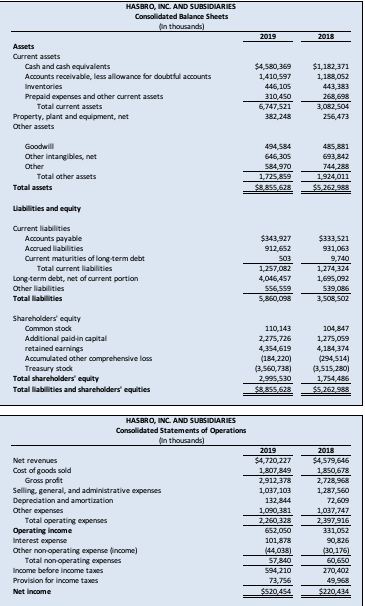
a.) Calculate Hasbro's and UHS's ROE for each fiscal year. Verify if the answers below are correct if not, show the correct answer.
| 2019 | 2018 | |
| Hasbro's ROE: | 17% | 13% |
| UHS ROE: | 15% | 15% |
Transcribed Image Text:Assets
Current assets
Cash and cash equivalents
Accounts receivable, less allowance for doubtful accounts
Inventories
Prepaid expenses and other current assets
Total current assets
plant and equipment, net
Property,
Other assets
Goodwill
Other intangibles, net
Other
Total other assets
Total assets
Uabilities and equity
Current liabilities
Accounts payable
Accrued liabilities
Current maturities of long-term debt
Total current liabilities
Long-term debt, net of current portion
Other liabilities
Total liabilities
Shareholders' equity
Common stock
Additional paid-in capital
retained earnings
Accumulated other comprehensive loss
Treasury stock
Total shareholders' equity
Total liabilities and shareholders' equities
HASBRO, INC. AND SUBSIDIARIES
Consolidated Balance Sheets
(in thousands)
Other expenses
Net revenues
Cost of goods sold
Gross profit
Selling, general, and administrative expenses
Depreciation and amortization
Total operating expenses
Operating income
HASBRO, INC. AND SUBSIDIARIES
Consolidated Statements of Operations
(in thousands)
Interest expense
Other non-operating expense (income)
Total non-operating expenses
Income before income taxes
Provision for income taxes
Net Income
2019
$4,580,369
1,410,597
446,105
310,450
6,747,521
382,248
494,584
646,305
584,970
1,725,859
$8,855,628
$343,927
912,652
503
1,257,082
4,046,457
556,559
5,860,098
110,143
2,275,726
4,354,619
(184,220)
(3,560,738)
2,995,530
$8,855,628
2019
$4,720,227
1,807,849
2,912,378
1,037,103
132,844
1,090,381
2,260,328
652,050
101,878
(44,038)
57,840
594,210
73,756
$520,454
2018
$1,182,371
1,188,052
443,383
268,698
3,082,504
256,473
485,881
693,842
744,288
1,924,011
$5,262,988
$333,521
931,063
9,740
1,274,324
1,695,092
539,086
3,508,502
104,847
1,275,059
4,184,374
(294,514)
(3,515,280)
1,754,486
$5,262,988
2018
$4,579,646
1,850,678
2,728,968
1,287,560
72,609
1,037,747
2,397,916
331,052
90,826
(30,176)
60,650
270,402
49,968
$220,434
Expert Solution
This question has been solved!
Explore an expertly crafted, step-by-step solution for a thorough understanding of key concepts.

Step by step
Solved in 2 steps

Recommended textbooks for you
Intermediate Accounting: Reporting And Analysis
Accounting
ISBN:
9781337788281
Author:
James M. Wahlen, Jefferson P. Jones, Donald Pagach
Publisher:
Cengage Learning

Financial Accounting: The Impact on Decision Make…
Accounting
ISBN:
9781305654174
Author:
Gary A. Porter, Curtis L. Norton
Publisher:
Cengage Learning

Cornerstones of Financial Accounting
Accounting
ISBN:
9781337690881
Author:
Jay Rich, Jeff Jones
Publisher:
Cengage Learning
Intermediate Accounting: Reporting And Analysis
Accounting
ISBN:
9781337788281
Author:
James M. Wahlen, Jefferson P. Jones, Donald Pagach
Publisher:
Cengage Learning
Financial Accounting: The Impact on Decision Make…
Accounting
ISBN:
9781305654174
Author:
Gary A. Porter, Curtis L. Norton
Publisher:
Cengage Learning
Cornerstones of Financial Accounting
Accounting
ISBN:
9781337690881
Author:
Jay Rich, Jeff Jones
Publisher:
Cengage Learning

Principles of Accounting Volume 1
Accounting
ISBN:
9781947172685
Author:
OpenStax
Publisher:
OpenStax College

Auditing: A Risk Based-Approach to Conducting a Q…
Accounting
ISBN:
9781305080577
Author:
Karla M Johnstone, Audrey A. Gramling, Larry E. Rittenberg
Publisher:
South-Western College Pub