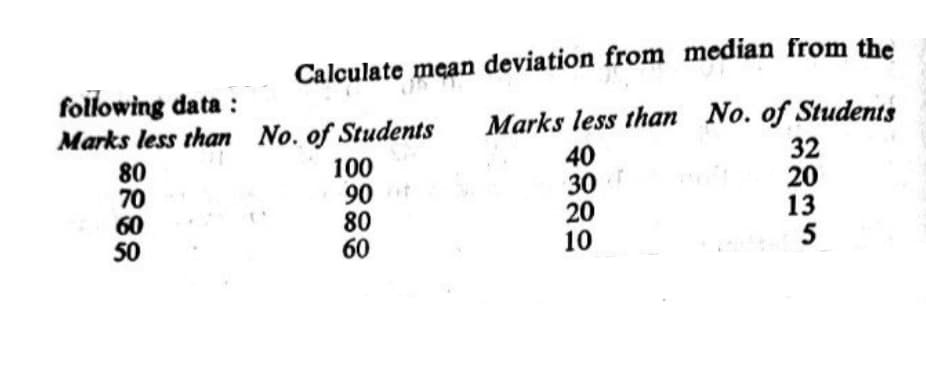
Calculate mean deviation from median from the following data : Marks less than No. of Students 80 70 60 50 Marks less than No. of Students 100 90t 80 60 40 30 20 10 32 20 13 5


Q: How many apps? According to a website, the mean number of apps on a smartphone in the United States ...
A: GivenMean(μ)=89standard deviation(σ)=22
Q: The main cost of a 5 pound bag of shrimp is $46 with a variance of 49 if a sample of 48 bags of shri...
A:
Q: The sociologists Stephan and Mishler found that the exponential function N(p) = N1e-1 (p-1) for 1 < ...
A: Given that, N(p)=N1e-.11(p-1) for 1≤p≤10 where, N1 represents the number of times the fi...
Q: The lengths of pregnancies in a small rural village are normally distributed with a mean of 269 days...
A: Let X be the random variable from normal distribution with mean (μ) = 269 days and standard deviatio...
Q: In 2013 students from a Statistics class at FSEV UK were asked to survey their friends who were 15-3...
A: In this question survey of interest area in between 15-30 years We need to describe p value associat...
Q: For Questions 1 and 2. Describe a method for using a table of random digits to obtain the samples. T...
A: We need to select a sample of size 5, from a group of population 30 To do this, select two digit nu...
Q: The following table is a partial probability datribution for the MRA Company's projected profits ( p...
A:
Q: (i) Calculate the probability that the advertisements are clicked on at least 10 times in a one minu...
A:
Q: Guide Question: 1. What keywords will lead you to arrive at the correct answer? Exercise 2: Complete...
A: The Mean is the measure of central tendency. It provide the average observation in the data set. It ...
Q: Determine the area under the standard normal curve that lies to the left of (a) Z= - 0.64, (b) Z = -...
A: Here we have to find the area to the left of z score
Q: (f) Plot 95% confidence limits for the mean response on the graph around the regression line.
A: Soln ## R Code # Importing the dataset dataset = read.csv('Data_6Feb20.csv') head(dataset) ## a) Plo...
Q: a) What is the smallest P(A or B) can be? _________ (b) What is the largest P(A or B) can be? __...
A: Given: P(A)=1/2 P(B)=1/3
Q: 4. Use Descriptive Statistic tool on the Data Analysis to find the follov а. Мean b. Mode c. Median ...
A: Since you have posted a question with multiple sub-parts, as per our guidelines we have provided ans...
Q: Which symbol is used for standard deviation of the population? O b. a O c.o o d.o?
A: We have given that, Which symbol used for standard deviation of the population? We have to check t...
Q: 1. P(B) Р (А аnd B) 4 find P(A) 8 2. P(A) = 20' 9 Р (А аnd B). 27 find P(B) = 200 3. P(B) = 0.2, P (...
A: As per company guidline i solved exactly three subpart of the question. Thank alot
Q: The mean weight of 150 students in a class is 60 kg. The mean weight of boys in the class is 70 kg. ...
A: Let x̄1 be the mean of Boys x̄2 be the mean of girls n1 be the number boys in the class n2 be th...
Q: A computer manufacturing company claims that only 7.5% of their computers are returned. Kelly thinks...
A:
Q: A computer manufacturing company claims that only 7.4% of their computers are returned. Kelly thinks...
A:
Q: Hypothesis testing favors sample scores that differ from the mean score by chance alone. The numb...
A: Given: Hypothesis testing favors sample scores that differ from the mean score by chance alone. ...
Q: mean median and standard deviation from the following data : X Problem 16: Calculate the coefficient...
A:
Q: You have just taken ownership of a pizza shop. The previous owner told you that you would save money...
A: On the basis of given data, we have to check the difference due to chance or is the distributor give...
Q: The number of people entering a security check-in lineup in a 15-minute interval at a medium sized a...
A: Given,P(X=x)=e-1717xx! ; x=0,1,2,.....
Q: Show the areas of 5" and 6.5" in the normal curve.
A: Given data, 6.755 6.4 7 8.1 5.8 7.5 9 8.5 7.2 6.9 6.75 9.15 6.2 8.1 ...
Q: 2. Determine the Standard Deviation and Variance of the data set as shown and compare the results us...
A:
Q: The population mean for an IQ test is 100 and the population standard deviation is 15. You collect d...
A:
Q: Assume that the random variable X is normally distributed, with mean u= 64 and standard deviation o ...
A: Let X be the random variable from normal distribution with mean (μ) = 64 and standard deviation (σ) ...
Q: Forty randomly selected students were asked the number of pairs of sneakers they owned. Let X = the ...
A: *As per the company guidelines only 3 subparts can be answered at a time. Kindly resubmit the questi...
Q: The age distribution of the members of a cer- tain children's club is as follows: Age on last birthd...
A:
Q: For Questions 4 through 6. School test results sometimes produce skewed graphs, especially if the te...
A: The appropriate distribution of the test score for both fifth graders and second graders is to be ex...
Q: * If HO : u=30 HA: μ #30 Ο HA: p 30 Ο all above dont of them O
A:
Q: A clinic measured the systolic blood pressure for a random sample of 10 patients. The resulting 95% ...
A: We have given that, Sample size (n) = 10 and 95% confidence interval = (111.3, 129.5) Then, We wi...
Q: A communication system consists of n components, each of which will independently functions with pro...
A: Given: Probability that system operate effectively is p System will operate effectively if at least ...
Q: The mean gas mileage for cars driven by the students at Chillville High School is 28.0 miles per gal...
A:
Q: ] Let A be a set of n 2 2 distinct mimbers and let aja2- an be a permutation of A. For i = 2,3, ...n...
A:
Q: Variety 1 2 3 4 5 6 A 35.3 31.0 32.7 36.8 37.2 33.1 B 30.7 32.2 31.4 31.7 35.0 32.7 C 38.2 33.4 33.6...
A: Obtain the value of test statistic F value for the treatment. Use EXCEL Procedure to obtain the va...
Q: Given a population where p = 0.10, find the standard deviation of the sampling distribution (aka the...
A: Given,p=0.10q=1-0.10=0.9
Q: Which is the best investment company to invest in: Investment Company A Possible Return Probability ...
A:
Q: With the new mean and standard deviation, how many standard deviations away from the mean is the val...
A: The standard deviation can be considered as the average difference between an observation and the me...
Q: A regional retail corporate team is contemplating a decision to purchase an automated customer serv...
A: (a) Obtain the probability that none will automatically opt to talk to a live operator. The prob...
Q: The sales of a coffee shop in a commercial district is very difficult to predict. The total revenue ...
A: Random experiment An experiment, whose outcome is from the events that are completely known but the ...
Q: If n=26, ¯xx¯(x-bar)=45, and s=6, construct a confidence interval at a 98% confidence level. Assume ...
A:
Q: y (wear) #1 (oil viscosity) 2 (load) 193 230 172 91 1.6 851 816 1058 1201 15.5 22.0 43.0 113 33.0 13...
A: In this question given that table of wear and oil viscosity Find σ2 by using multiple regression
Q: question (9): A researcher was interested in the effect of job security on stress. The researcher...
A: Given a situation on job security and stress. We have to write the statement is true or false.
Q: The yields of a genetically modified wheat (in bushels per acre) were compared for five different va...
A: Disclaimer : “Since you have posted a question with multiple sub-parts, we will solve first three su...
Q: Maddie conducts a study to see if listening to music helps students learn math. She surveys a rando...
A: Given that Maddie conducts a study to see if listening to music helps students learn math. She surve...
Q: In a survey, 17 people were asked how much they spent on their child's last birthday gift. The resul...
A:
Q: 11. Based on the data, what is the mean nominal wage? Nominal Wage 537.00 350.00 Real Wage Region NC...
A: Given The data is as follows:
Q: 17) On this worksheet, make an XY scatter plot linked to the following data: ...
A: Introduction: The predictor variable is X, and the response variable is Y. Denote Ŷ as the predicted...
Q: Suppose we are interested in the Annual Salary of Electronics Associated, Inc. (EAI) managers and we...
A:
Q: 13) Construct a Box-and-Whisker Plot for the set of data. Label all parts.
A: For the given data: 1, 3, 3, 7, 8, 8, 11, 14,15, 19, 21, 21, 21 We need to construct a Box-and-Whisk...

Step by step
Solved in 3 steps with 3 images
