Calculate Pearson's coefficient of skewness : 32.5 37.5 42.5 47.5 12.5 17.5 22.5 27.5 X: 108 129 61 45 33 f: 28 42 54
Calculate Pearson's coefficient of skewness : 32.5 37.5 42.5 47.5 12.5 17.5 22.5 27.5 X: 108 129 61 45 33 f: 28 42 54

Algebra & Trigonometry with Analytic Geometry
13th Edition
ISBN:9781133382119
Author:Swokowski
Publisher:Swokowski
Chapter2: Equations And Inequalities
Section2.1: Equations
Problem 75E

Related questions
Question
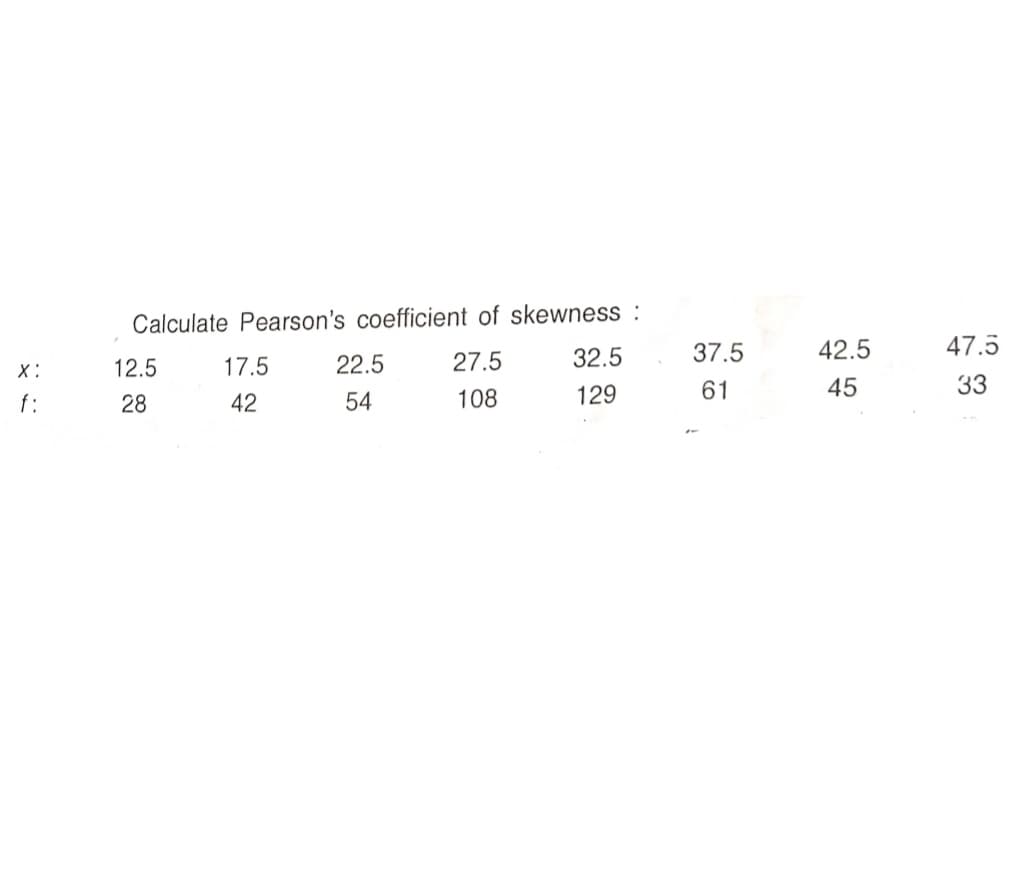
Transcribed Image Text:Calculate Pearson's coefficient of skewness :
12.5
17.5
22.5
27.5
32.5
37.5
42.5
47.5
X:
f:
28
42
54
108
129
61
45
33
Expert Solution
This question has been solved!
Explore an expertly crafted, step-by-step solution for a thorough understanding of key concepts.

This is a popular solution!

Trending now
This is a popular solution!

Step by step
Solved in 2 steps

Recommended textbooks for you
Algebra & Trigonometry with Analytic Geometry
Algebra
ISBN:
9781133382119
Author:
Swokowski
Publisher:
Cengage

Mathematics For Machine Technology
Advanced Math
ISBN:
9781337798310
Author:
Peterson, John.
Publisher:
Cengage Learning,

Algebra & Trigonometry with Analytic Geometry
Algebra
ISBN:
9781133382119
Author:
Swokowski
Publisher:
Cengage
Mathematics For Machine Technology
Advanced Math
ISBN:
9781337798310
Author:
Peterson, John.
Publisher:
Cengage Learning,